Introduction
At the early processing stages in visual cortex, information is laid out in the form of maps of the retinal image. However, contrary to intuition, uniform surfaces are not mapped by uniform distributions of neural activity. We can perceive the three-dimensional (3D) shape of a uniform surface, but stereoscopic neurons are activated only by the contours of the surface, not the uniform interior. We perceive a uniform color figure, but color-selective neurons respond about five times less to the interior of the figure than to its boundaries. How cortical neurons signal contour and surface features is well known, but we do not yet understand how the brain “organizes” these feature signals to represent surfaces and objects. In this topic, I summarize studies showing that the visual cortex codes surface color, depth ordering of surfaces, and border ownership in the contour signals.
FIGURE 8.1 The problem of image segmentation and the definition of occluding contours.
The signaling of border ownership (the one-sided assignment of borders that determines perceptual figure-ground organization) is the key finding, because it reveals mechanisms of feature grouping. I discuss how these mechanisms might be used by the system to represent objects and compute surface attributes.
Biological vision systems infer 3D structure from images and have evolved to perform this task in a world that has a specific physical structure. The fundamental problem of vision is that 3D scenes are projected onto a two-dimensional (2D) receptor surface; things that are widely separated in space give rise to adjacent regions in the projection (Figure 8.1). The resulting images are composed of regions corresponding to different objects. The boundaries between the regions are given by the geometry of interposition and are called occluding contours. Thus, theoretically, images of 3D scenes can be decomposed, or “segmented” into regions separated by contours. The segmentation result might then be used to infer physical surfaces and the shapes of objects. To do this in practice is difficult, and the primate visual system devotes hundreds of millions of cells to this task.
Results
Surface Color1
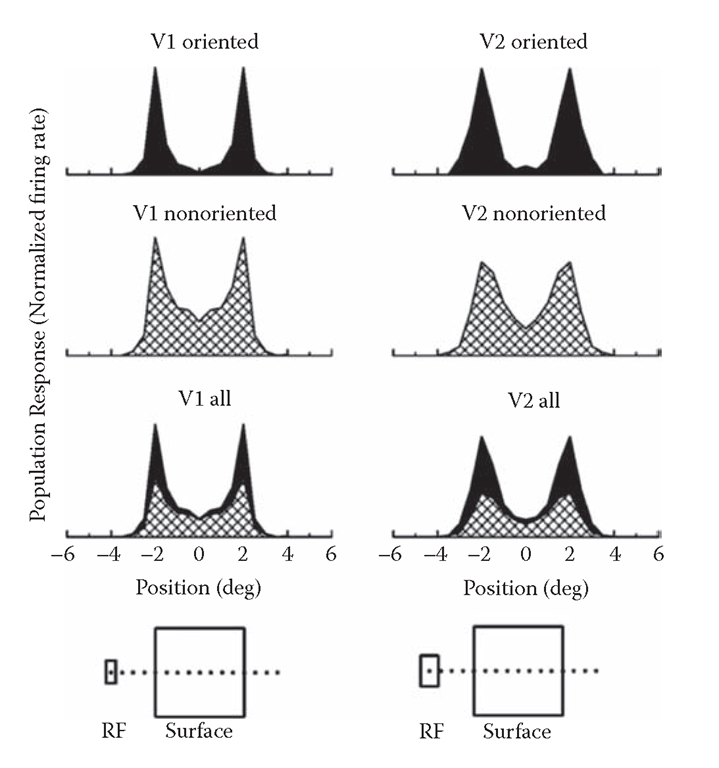
One of the most surprising findings of modern vision research was the discovery of orientation selectivity of neurons in the visual cortex and the emphasis on edges (discontinuities of intensity and color) in the cortical representation. This can be appreciated by looking at the profile of neuronal activity across the representation of the surface of a uniformly colored object (Figure 8.2). The results presented here are based on single-cell recordings from the macaque visual cortex under awake behavioral conditions (Friedman, Zhou, and von der Heydt, 2003). The curves show the firing rates of the neurons as a function of the location of the receptive field (RF) relative to a square figure. The curves represent averaged responses of neurons with near-foveal receptive fields; the square measured either 4° or 6° on a side, a multiple of the size of the receptive fields. About 80% of the neurons in V2 and the supragranular layers of V1 are strongly orientation selective. As shown by the top curves in Figure 8.1, these cells respond to the edges but are virtually unresponsive to the uniform interior of the square. The curves below show that nonoriented and weakly oriented cells, although activated by the uniform surface, also emphasize the edges by about a factor of 3. As a result, the total activity in these regions of cortex is about five times higher at the edges than in the center of the square (bottom curve; in combining the activity profiles of oriented and nonoriented cells, the relative number of cells was taken into account along with the fact that only a small fraction of the oriented cells are activated by the edges at any given orientation, while all nonoriented cells contribute activity).
An important point is that the proportion of color-selective neurons is at least as high among oriented cells as it is among nonoriented cells (Friedman, Zhou, and von der Heydt, 2003). Because of the overwhelming preponderance of orientation-selective neurons, this means that color information is predominantly carried by orientation-selective edge responses.
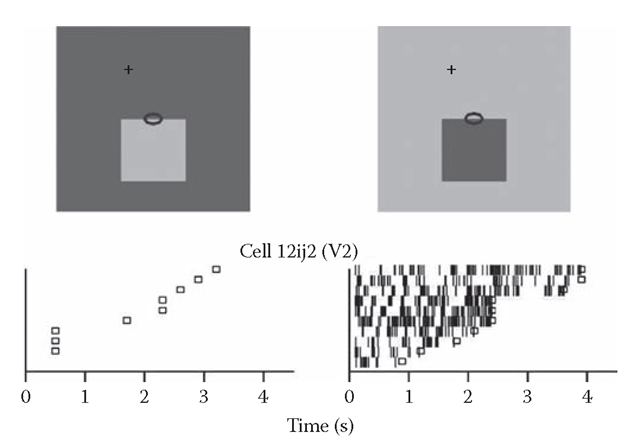
How can edge signals code for surface color? Edge-selective neurons respond when their receptive field is on the border between two regions of different color. If the neurons were to signal the color of a surface, and not just the presence of an edge, they should be able to differentiate on which side the color is located. We found that most cells discriminate the polarity of the color difference at the edge. Figure 8.3 shows an example of such a neuron. (The response profiles of Figure 8.2 do not reveal selectivity for contrast polarity, because responses were averaged over neurons without regard to contrast preference.) Thus, the edge responses of oriented neurons carry directional color information that is essential for coding surface color.
FIGURE 8.2 Response profiles across the representation of a square of uniform color in the macaque visual cortex. The plots show the averaged population responses for orientation-selective cells (top), nonorientation-selective cells (below), and for the combined activity of both (bottom). (Left) area V1 (supragranular cells only); (right) area V2. The responses are plotted as a function of the receptive field position relative to the square, as depicted schematically at the bottom. The color and the orientation of the square were optimized for each cell. The combined responses (bottom plot) were calculated by weighting the groups according to their respective encounter frequencies and taking into account that the expected firing rates of oriented cells are only about 20% of their maximum firing rates, because a figure of a given orientation will stimulate most cells at nonoptimal orientation.
FIGURE 8.3 Selectivity for edge contrast polarity. Responses of an example neuron of V2. The raster plots show the sequences of action potentials in response to repeated presentations of the stimuli depicted above (oval indicates receptive field). Small squares mark the end of the monkey’s fixation period.
The strong dominance of edge signals in the cortex is hard to reconcile with our subjective experience when looking at a surface of uniform color; the color is no less vivid in the center than at the edges. An attempt to resolve this paradox is the “filling-in” theory that postulates a representation in which color signals spread from the boundary of a surface into the interior and fill it up, thus creating the uniform distribution that perception suggests. We wondered if perhaps a subpopulation of V1 or V2 neurons participates in this process, and that some of the signals that we recorded for the center of the square (Figure 8.2) might reflect filling-in. Thus, we studied a paradigm of illusory filling-in. We measured perceptual filling-in in monkeys and recorded the neural signals in the visual cortex of the same animals (Friedman, Zhou, and von der Heydt, 1999; von der Heydt, Friedman, and Zhou, 2003). We found that when the fill-ing-in occurred, the nonoriented neurons in V1 and V2 continued to signal the actual color of the stimulus at their receptive fields, and not the color that was perceived. However, the color edge signals of the oriented neurons decayed at a rate that was consistent with the filling-in.
We conclude that the uniform appearance of surface color does not have an isomorphic correlate in the neural activity in lower-level visual areas. Surface color might be computed from the edge signals, which presumably occurs at a higher level. The uniformity of perception does not correspond to a uniform distribution of activity, but may reflect a more abstract representation.
Surface Depth
Color information is directly available at the receptor level, but depth is the dimension that is lost in the image and needs to be reconstructed by the system. Primates and many other species have a specific mechanism for this, using the disparity between the images of the two eyes, providing binocular stereopsis. Because disparity information derives from matching structures in two different images, which cannot be done in uniform image regions, stereoscopic information is characteristically sparse. In the case of a uniform square, for example, stereoscopic information is available from the edges but not the surface. Disparity can define the depth of the contour of the square but does not indicate whether the surface inside the contour is flat, convex, or concave, and if it is located at the depth of the contour or behind the contour. It could be an object in front, or a surface in back that is seen through a square window.
The sparse representation of depth in the cortex is illustrated in Figure 8.4, where the top row shows the response profiles of three disparity selective neurons. In each case, the stimulus, a uniform square, was presented with the optimal disparity for the neuron. As a result, the edges of the square produced strong responses. However, the surface did not elicit any activity, as expected, because there was no structure in the receptive field that could stimulate the disparity selective-response mechanism.
A different situation is illustrated in the second row of Figure 8.4. It shows the responses of the same neurons to random-dot stereograms, portraying the square in depth, floating in front of a background surface. (This kind of stimulus in which a figure is defined by disparity but has no contours in monocular view, has been called “cyclopean” [Julesz, 1971].) As in the case of the uniform figures, the squares were presented with the optimal disparity for each neuron. Thus, it might be expected that the neurons would now be activated whenever their receptive field was inside the square. This was the case for neurons of V1, as can be seen in the example of cell 1. However, neurons of V2 often responded again in the edge-selective manner, producing no activity when the receptive field was inside the cyclopean square, despite the fact that the random-dot texture had the optimal disparity (von der Heydt, Zhou, and Friedman, 2000).
FIGURE 8.4 The response profiles across luminance-defined and disparity-defined figures of three disparity-selective cells in macaque visual cortex. Conventions are as in Figure 8.3. (Top) The luminance-defined figures produced edge-selective responses in all three cells, as expected, because the cells were orientation selective. (Below) The random-dot stereograms produced surface response in cell 1, but edge-selective responses in cells 2 and 3. Stereoscopic edge selectivity wa found only in V2.
It is amazing that neurons in V2 can detect the contours of cyclopean figures. These neurons respond to color-defined edges, as do simple and complex cells of V1, and also respond to cyclopean edges that are devoid of edge contrast. Clearly, these two conditions require radically different mechanisms. Unlike color, disparity information first needs to be extracted by correlating the information from the two eyes, which can only be done in V1. The mechanisms then have to detect edges in the disparity map. The cyclopean edge cells of V2 are also exquisitely tuned to the orientation of the 3D edge, and the tuning generally agrees with their tuning for contrast-defined edges (von der Heydt, Zhou, and Friedman, 2000).
The presence of stereoscopic surface responses in V1 and the emergence of edge selectivity in V2 reveal something general about the strategy of surface representation in the cortex. Random-dot stereograms carry ample disparity information all across the area of the displayed object and thus define the 3D shape of its surface perfectly. And yet, the system shifts the emphasis from surface to edge signals. The emergence of a 3D edge representation with orientation-selective neurons in V2 is analogous to the emergence of orientation selectivity in simple cells of V1. The repetition of the same strategy in the processing of depth indicates that representation of contours plays a fundamental role, not only in 2D, but also in the representation of the 3D shape.


