Geoscience Reference
In-Depth Information
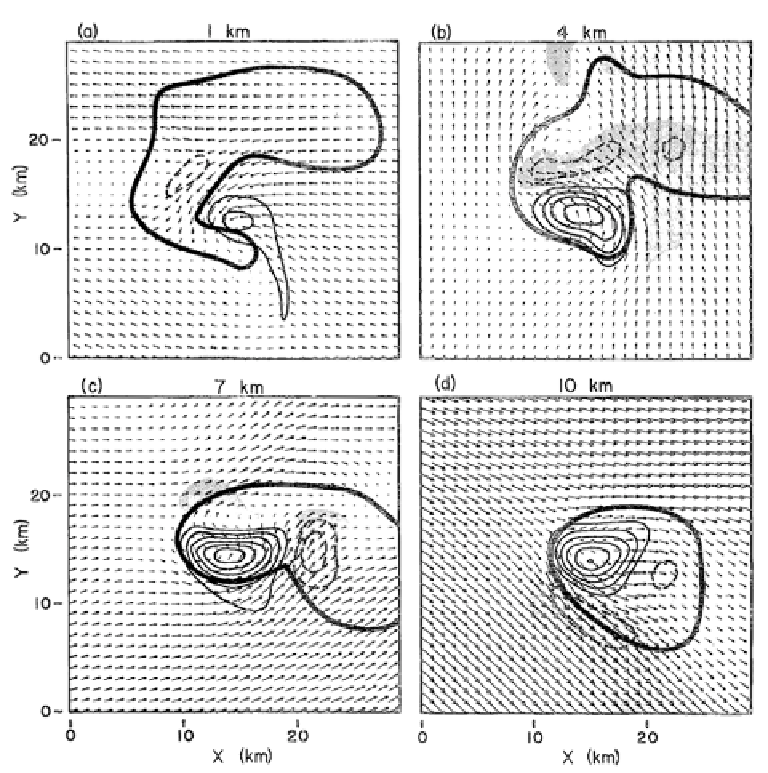
Figure 4.8. An early simulation of a supercell using the Klemp-Wilhelmson numerical cloud
model. Horizontal cross sections of storm-relative winds (vectors) at four levels in the model at
2 h after the storm had been initiated by a thermally buoyant bubble. Updraft velocities (solid
lines) and downdraft velocities (dashed lines) are contoured at 5m s
1
increments. Shaded
regions mark regions of downdrafts in excess of 1m s
1
. The heavy solid line outlines the
rainwater field enclosed by the 0.5 g kg
1
contour. Wind vectors are scaled such that one grid
interval represents 20m s
1
. The horizontal grid spacing in the model is 1 km (from Klemp et
al., 1981).
at lower altitude. The BWER sometimes assumes an arc shape (
Figure 4.11
), indi-
cative of a curved region of updraft (U shaped, horseshoe shaped, or crescent
shaped). The high intensity (
50m s
1
) of updrafts in supercells has been con-
firmed (
Figures 3.14
and
3.15
) from measurements made by a storm-penetrating,
armored aircraft, from the ascent rate of balloons launched into updrafts, and
corroborated with measurements
in numerically simulated storms by cloud
models.
Search WWH ::

Custom Search