Geoscience Reference
In-Depth Information
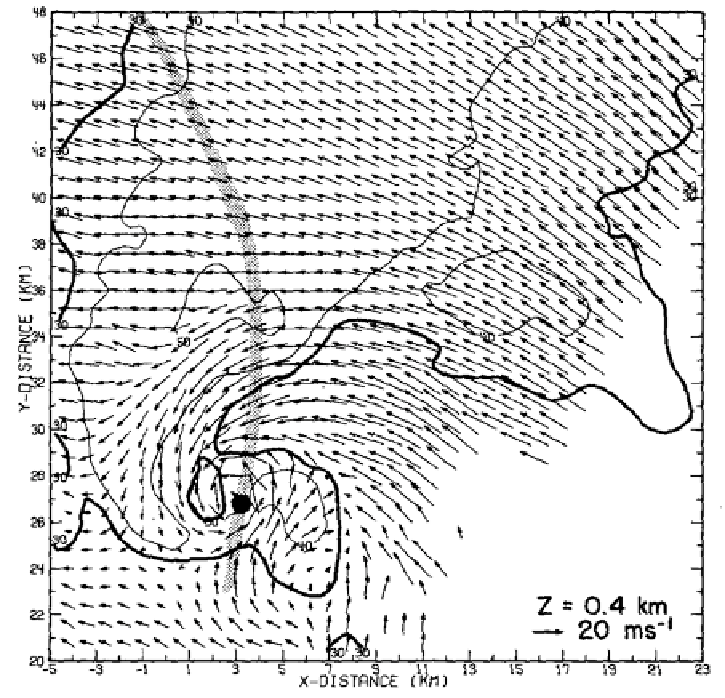
Figure 4.7. Storm-relative winds at 400m AGL, synthesized from an early dual-Doppler radar
analysis using fixed site radars operated by NSSL on May 20, 1977 in central Oklahoma. The
tornado damage path is indicated by a stippled line; the tornado at the time of the analysis is
indicated by a black dot. Solid lines are radar reflectivity factor (dBZ) from one of the radars;
thick solid line is the 30 dBZ contour (from Brandes, 1981).
the updraft. The existence of a strong updraft was inferred indirectly from the
weak-echo region (WER) and bounded weak-echo region (BWER) seen in radar
reflectivity constant elevation angle data or constant altitude data
3
(i.e., in a
quasi-horizontal plane) (
Figures 4.9
and 4.10). From the WER and BWER it was
inferred that large-enough (i.e., radar-detectable) particles did not form until
relatively high up in the cloud: It takes time for cloud droplets to grow into pre-
cipitation-size particles and, in a very strong updraft, it does not take long for air
coming from low altitudes to reach very high altitudes. Surrounding the core of
the updraft, where the updraft strength is weaker, radar-detectable particles form
3
Looked at as a vertical cross-section it was named a ''vault''.
Search WWH ::

Custom Search