Geoscience Reference
In-Depth Information
0.5
a)
b)
0.6
0.4
0.2
0
0
Simulation (d01)
Mohonk Residual
-0.2
Simulation (d01)
Mohonk Residual
-0.5
-0.4
MAY JUL SEP NOV JAN MAR MAY JUL SEP
MAY JUL SEP NOV JAN MAR MAY JUL SEP
PREVIOUS YEAR
GROWTH YEAR
PREVIOUS YEAR
GROWTH YEAR
3
c)
d)
2
0.8
1
0.6
0
-1
0.4
G
G
G
G
W
-2
0.2
-3
-4
JAN
MAR
MAY
JUL
SEP
NOV
JAN
1930
1940
1950
1960
1970
Year
Month
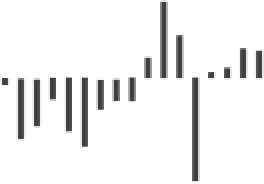
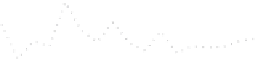
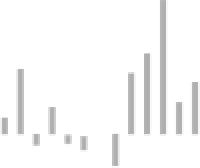
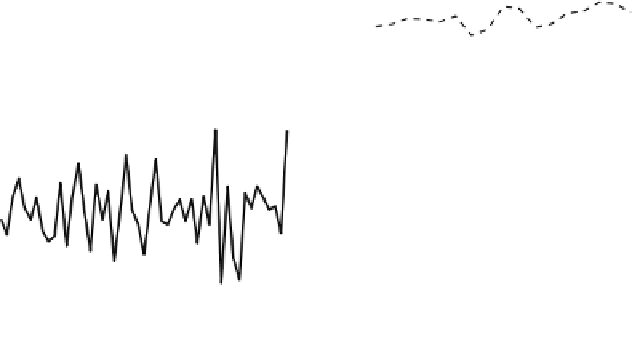
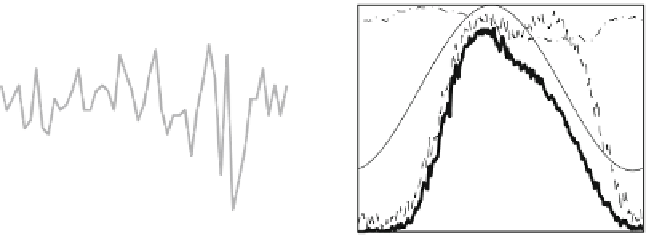
Fig. 3.5
Simulation of Mohonk Lake tree-ring width chronology. Correlation of previous and cur-
rent year tree-ring widths with (
a
) temperature and (
b
) precipitation show similar patterns for both
simulated and actual chronologies.
Dashed lines
of the same color show the 95% two-tailed con-
Values above these lines can be considered statistically significant, accounting for the number of
independent predictors (
c
) The simulation (
black line
) is correlated with the actual chronology
(
gray line
)at
r
0.05). (
d
) Growth functions
G
T
,
G
W
,
G
E
, and overall growth function
=
0.57(
p
<
early season growth is strongly tied to the timing of early spring (March) warm-
ing, unless such warming is strong enough by early summer (May), in which case
warm conditions lead to growth limitation by moisture stress. The way in which
Given these results, maybe in this specific case it's not emergence after all. Our
tentative conclusion is that current-generation multivariate linear regression models
may be unable to completely describe the environmental controls on tree-ring varia-
tions because of intraseasonal-interannual changes in the limiting factors controlling
Forward modeling exercises like this can complement statistical model verification
procedures, assess the influence of such effects in linear paleoclimate inversions,
increase confidence in our interpretation of the data ('What do we expect to see?'),