Geoscience Reference
In-Depth Information
2
2
Hatanga: r
1
=0.55***; r
5
=0.64**
Coku: r
1
=073***; r
5
=0.80**
1.5
1.5
1
1
0.5
0.5
0
0
1950
1960
1970
1980
1990
1930
1940
1950
1960
1970
1980
1990
2
2
Olenek: r
1
=0.26**; r
5
=0.43
Tura:r
1
=0.45***; r
5
=0.68**
1.5
1.5
1
1
0.5
0.5
0
0
1940
1950
1960
1970
1980
1920
1940
1960
1980
2
2
Turuchan: r
1
=0.37**; r
5
=0.73**
Ulan−Ude: r
1
=0.56***; r
5
=0.66***
1.5
1.5
1
1
0.5
0.5
0
0
1960
1970
1980
1990
1920
1940
1960
1980
2
2
Verhoyn: r
1
=0.11; r
5
=0.22
Zigansk: r
1
=0.24**; r
5
=0.65**
1.5
1.5
1
1
0.5
0.5
0
0
1880
1900
1920
1940
1960
1980
1930
1940
1950
1960
1970
1980
1990
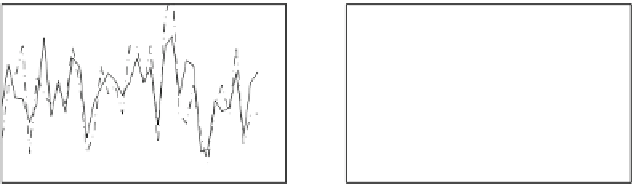
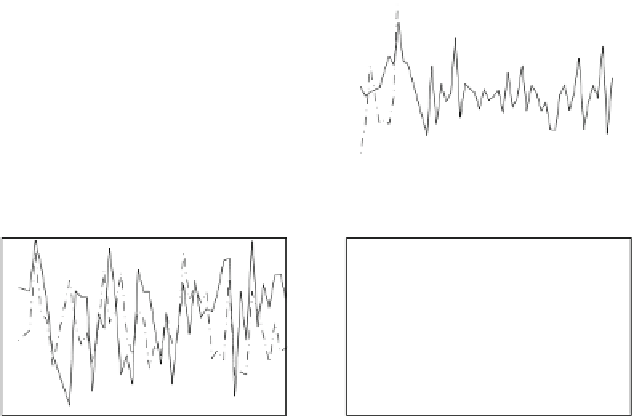
Fig. 3.4
Time series of Vaganov-Shashkin model simulations (
dashed lines
) compared with actual
ring width chronologies (
solid lines
) from high-latitude sites across Russia. Correlations are for
annual and five year averages.
∗
,
∗∗
,
∗∗∗
indicate one-tailed significance at
p
0.1, 0.05, 0.01
levels, respectively, considering effective degrees of freedom given series lag-1 autocorrelations.
Chokurdakh (Coku) (147.9
◦
E, 70.6
◦
N). Hatanga (102.5
◦
E, 72
◦
N). Olenek (112.4
◦
E, 68.5
◦
N). Tura
(100.0
◦
E, 64.2
◦
N). Turuchan (88.0
◦
E, 65.8
◦
N). Ulan-Ude (107.4
◦
E, 51.8
◦
N). Verhoyn (133.4
◦
E,
<