Geoscience Reference
In-Depth Information
SESCAT Doppler spectra Y : 1992 D : 214
Start (LT) : 0 40 24.83 End (LT) : 0 43 25.06
Power spectra Ave. time (s) : 8.19
0
1
2
3
4
5
6
7
8
9
10
11
12
13
14
15
16
17
18
19
20
21
22
2
400
2
200
0
200
400
15 30
Rel. power
45 60
Vr, m/s
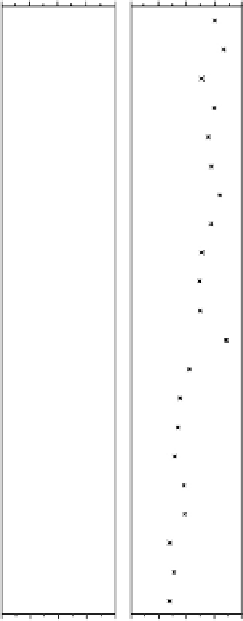
Figure 6.31
A detailed sequence of self-normalized Doppler power spectra prior, dur-
ing, and after the occurrence of typical type 1 echoes (numbers 7-11), characterized by
an invariant peak at velocities about
300m/s. The 22 boxes correspond to 22 ranges.
These are generated by the Farley-Buneman instability during a brief period of an impul-
sive electric field that exceeds the instability threshold near the ion acoustic speed. Also
seen are typical type 2 echoes (numbers 1-4 and 15-22), characterized by a broad and
variable spectrum centered at low Doppler shifts. Type 2 irregularities are believed to be
secondaries generated from longer wavelength waves during conditions of strong plasma
turbulence. [After Schlegel and Haldoupis (1994). Reproduced with permission of the
American Geophysical Union.]
−
Most convincing are the results obtained by Goodwin and Summers (1970),
who used a network (near Brisbane, Australia) of two ionosondes, and four
receivers that were geographically separated. With this network, 10 reflection
points in the ionosphere could be monitored. They categorized
E
s
into two types:

Search WWH ::

Custom Search