Geoscience Reference
In-Depth Information
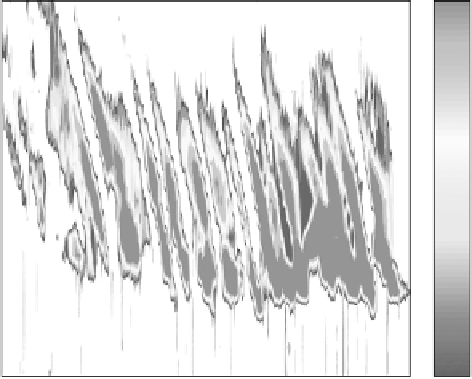
Gadanki, 12-13 June, 2001
110
12
10
108
8
106
6
104
4
102
2
0
100
-2
98
00:05
00:10
00:15
00:20
00:25
00:30
00:35
00:40
00:45
Time (IST)
Figure 6.32
Q-P radar echoes observed with the Gadanki radar. (Figure courtesy of
R. K. Choudhary.) See Color Plate 20.
“steady” and “changing.” At night, 77% of the observed
E
s
were of the chang-
ing type, with a much lower occurrence probability during the day. Most of the
changing types were found to be elongated structures that appeared to move
horizontally without change of form in any 15-minute interval. The distribution
of drift directions associated with “ridges” in 110
E
s
frontal structures are pre-
sented in Fig. 6.33. The finding that drift azimuths were tightly clustered about
the northwest and southeast directions is consistent with the passage of frontal
structures. Similar results were obtained earlier by Clark (1965), whose results
have been reproduced in Bowman (1985).
More recent VHF observations from St. Croix have been made in conjunction
with high-resolution incoherent scatter observations of the plasma density pro-
files using the dual beam system (Hysell et al., 2004). These also found large-scale
waves with occasional type 1 characteristics. Interferometric data showed that
the Q-P-like echoes came from near 105 km event, although the range versus time
presentation could have beenmisinterpreted as a height change. The echoing peri-
ods were collocated with patches of high density plasma at 105 kmmoving across
the dual beam system. The horizontal interferometry (see Fig. 6.34) showed that
the echoing regions were aligned from northwest to southeast.
Finally, Urbina et al. (2000) reported on a weak echoing region over Puerto
Rico located below 100 km, which seems to be almost always present at night.
The signal is relatively featureless with low Doppler shifts toward the radar and
narrow spectra.


Search WWH ::

Custom Search