Geoscience Reference
In-Depth Information
1000
Dipole-dipole
Pole-dipole
(p
ole lef
t)
Pole-dipole
(p
ole righ
t)
Pole-dipole (pole right)
500
V
I
I
V
V
I
400
Dip=90°
Dip=60°
Dip=45°
300
V
I
200
1000
100
5
0 m
Dip directio
n
900
Top of source body (projected 25 m)
800
50
1000
1200
1400
1600
700
Location (m)
600
1000
Pole-dipole (pole left)
500
Dip=90°
Dip=60°
Dip=45°
500
400
400
1800
2000
2200
300
Location (m)
200
I
V
500 m
1000 m
100
Dip directio
n
Top of source body (projected 25 m)
Vertical contact
50
1000
1200
1400
1600
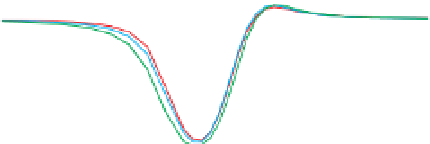
Figure 5.48
Resistivity profiles computed across a contact for the
pole
-
dipole array, with the current pole electrode to the right and to
the left, and the dipole
Location (m)
dipole array. Note the different asymmetrical
responses obtained with the two pole
-
1000
Dipole-dipole
-
dipole arrays.
Dip=90°
Dip=60°
Dip=45°
500
400
300
Example - Palmietfontein kimberlite
Resistivity profiling surveys were also conducted in the
vicinity of the Palmietfontein kimberlite pipe on north
V
I
200
100
-
south traverses spaced 100 m apart. The Schlumberger
array was used with the current dipole length (X
AB
) set to
150 m and the potential dipole length (X
MN
) set to 20 m.
Contours of apparent resistivity (
Fig. 5.46a
)
delineate
clearly the main Palmietfontein pipe, as well as a satellite
body to the northeast. A profile of these data shows the
decrease in resistivity of the shallow pipe-material com-
pared with the country rock (
Fig. 5.46b
). The higher gra-
dient (depicted by closer contour lines) in the resistivity
data across the northern margin indicates that this contact
is steeply dipping, and the lower gradient over the southern
margin indicates that it has shallower dip (see
Section
Dip directio
n
Top of source body (projected 25 m)
50
1000
1200
1400
1600
Location (m)
Figure 5.47
Resistivity pro
les computed across a conductive body,
for a range of dip, for the asymmetrical pole
dipole array with the
current pole-electrode located to the right and to the left of the
potential dipole, and for the symmetrical dipole
-
-
dipole array.
ation is quite simple and concentrates on identi
cation of
anomalous responses. Dif
culties occur owing to the
asymmetrical responses produced by geometrically asym-
metrical arrays, as shown by the computed responses in
Fig. 5.47
for the different current pole
-
electrode locations
-
in the pole
dipole array. It can be dif
cult to interpret
dips reliably from these. Note from the figure that for
the symmetrical dipole
Example - Silvermines carbonate-hosted massive sulphide
Resistivity/IP pro
le surveys guided exploratory drilling of
the Silvermines Zn
dipole array the asymmetric
response is due only to the dip of the body. Other diffi-
culties include complex responses at contacts between
units with different electrical properties (
Fig. 5.48
)and
the fact that the depth of penetration varies, being less in
conductive ground. In the contact example, the depth of
investigation is much less in the more conductive ground
than in the more resistive terrain on the other side of
the contact.
-
Ag deposit, Tipperary, Ireland, in
the early 1960s (Seigel,
1965
). Survey traverses across a
region adjacent to the Silvermines Fault, a structure known
to control mineralisation in the area, located several zones
of increased polarisation. A profile of time domain pole
-
Pb
-
-
dipole data (X
MN
¼
1) across the deposit is
shown in
Fig. 5.49
. Mineralisation, which is conformable
with dip, occurs in gently dipping dolomitic limestone
61 m, n
¼


Search WWH ::

Custom Search