Geoscience Reference
In-Depth Information
adjacent to the Silvermines Fault. Both massive and dis-
seminated sulphides are present, the latter containing a
high percentage of pyrite. Anomalously high apparent
resistivity and chargeability occur over the deposit, with
the maximum chargeability and minimum resistivity
occurring over the shallowest part of the mineralisation.
A subsidiary chargeability response further to the north is
probably due to pyrite in an overlying chert horizon.
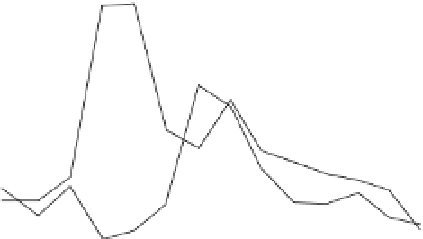
Apparent chargeability profiles obtained with the electrode
spacing set to 30 m and 122 m (changing both the dipole
length and spacing) are shown in
Fig. 5.49b
.
Note the
change in lateral resolution and response amplitude for
the different electrode separations.
a)
Apparent
resistivity
(
m)
Apparent
chargeability
(ms)
a
a
20
4000
V
I
15
3000
a = 61 m
M
2000
10
5
1000
0
0
00
5N
10N
15N
20N
25N
b)
Apparent
chargeability
(ms)
5.6.6.3
Pseudosections
Measurements from multiple electrode separations on the
same traverse can be displayed and analysed as individual
pro
25
25
a
a
V
I
20
20
can be displayed and analysed as a single entity in the form
of a pseudosection (see
Section 2.8.1
). The lateral position
and pseudo-depth of the measured values in the pseudo-
section conform to the data plotting convention for each
We describe here the pseudosections produced only by
the dipole
15
15
a=122m
10
10
5
5
a = 30 m
a=61m
0
0
dipole array; similar procedures and types of
characteristics apply to the other in-line arrays. Plotting of
the pseudosection is illustrated in
Fig. 5.50
. The measure-
ment from each dipole spacing (n) is assigned to the point
midway between the two active dipoles and located at the
intersection of two lines subtending an angle of 45° from
the surface midpoint of the current and potential dipoles.
Larger values of n correspond to greater depth of investi-
gation and are therefore plotted in lower regions of the
pseudosection. Measurements for the same value of n plot
on the same horizontal line. Their lateral position is deter-
mined by moving the two dipoles laterally whilst maintain-
ing their separation (
Fig. 5.50b
)
, so the horizontal spacing
of the plotted data is equal to the dipole length (X
MN
).
Figure 5.51
shows the responses of several simple models
of subsurface resistivity variations for the dipole
-
00
5N
10N
15N
20N
25N
c)
Sulphides
Massive
Disseminated
0
200
Metres
Faulted u/c
Figure 5.49
Silvermines Zn
-
Pb
-
Ag deposit. (a) Pole
-
dipole array
apparent resistivity and chargeability pro
les from the Silvermines
Zn
-
Pb
-
Ag deposit. (b) Chargeability profiles from the same survey
line for a range of dipole length and spacing. Note the change in
amplitude and lateral resolution between the profiles. Redrawn, with
permission, from Seigel (
1965
).
dipole
array displayed as pseudosections. It is obvious that the
source geometries are not replicated by the pseudosections.
The pseudosection response, in general, takes the form of
an inverted
-
plotting of the responses at locations extending diagonally
downwards results in the two pants legs.
Referring to
Fig. 5.51
, it is possible to determine some
characteristics of the source from the pseudosection. For
example, a vertical source produces a broader and
smoother pants-legs response as its depth increases. Dip
produces an asymmetric response, although determining
the dip direction can be problematic since the controls on
the nature of the asymmetry are complicated. Responses
'
response. The reason for the pants-legs response is shown
in
Fig. 5.52
. The zone with anomalous electrical properties
below the current (or potential) electrodes affects readings
regardless of the location of the other electrodes. The
'
V
'
shape. This is referred to as a
'
pants-legs


Search WWH ::

Custom Search