Geoscience Reference
In-Depth Information
interpreted to be due to a thin layer of resistive sur
cial
material (thickness
a)
A
¼
1.8 m,
ρ ¼
160
Ω
m ) overlying
Kimberlite pipes
weather bedrock (thickness
¼
16 m,
ρ ¼
17
Ω
m) and
70
0
200
underlain by fresh bedrock (
m). The sounding
from within the pipe was modelled using four layers,
although the middle two are similar in resistivity, which
gives the appearance of a three-layer ground. The upper
layer was interpreted as sur
cial material (thickness
ρ ¼
260
Ω
50
Metres
50
100
70
20
30
15
30
VES1
10
12
8
¼
1.9 m,
m). The next layer was also interpreted
as surficial material, specifically as ferruginous sand known
to occur in the area (thickness
ρ ¼
13.5
Ω
VES32
¼
4.3 m,
ρ ¼
5
Ω
m). This
I
is underlain by the yellow ground (thickness
¼
52 m,
V
ρ ¼
7
Ω
m), which is underlain by the more resistive blue
A'
ground (
m). The outer points of the sounding
were not modelled since the current electrodes were
located outside the pipe, violating the 1D assumption
inherent in the model. The higher resistivity of the country
rock causes an increase in apparent resistivity in this
section of the sounding curve.
The interpreted depth to blue ground is 58 m and is
within about 20% of the actual depth of these rocks, inter-
sected at 44 m and 45 m in nearby drillholes. The grad-
ational nature of the contact is probably the cause of this
large discrepancy. The contrasting resistivities of the vari-
ous components of the kimberlite are typical and are the
reason for the routine use of electrical and EM methods in
kimberlite exploration (Macnae,
1979
).
ρ ¼
20
Ω
b)
A
A
200
100
70
50
VES1
0
200
30
20
Metres
10
c)
Apparent resistivity ( m)
Apparent resistivity ( m)
1
10
100
1000
1
10
100
1000
10
0
10
0
10
1
10
1
Observed
Calculated
5.6.6.2
Profiles
In profiling mode, the survey line and the array are usually
oriented across the geological strike and the array moved
systematically along the line to produce a profile of the
subsurface resistivity and polarisation parameters. Profil-
ing surveys can be conducted with any of the electrode
arrays described in
Section 5.6.5
.
The spacing or the length
of the dipoles can be varied in order to change the investi-
gation depth.
Examples of pro
les for the commonly used pole
10
2
10
2
VES32
VES1
10
3
10
3
X
AB
/2 (m)
X
AB
/2 (m)
d)
Apparent resistivity ( m)
Apparent resistivity ( m)
1
10
100
1000
1
10
100
1000
10
0
10
0
Soil & alluvium
-
Ferruginous
sand
dipole and dipole
-
Weathered
norite
10
1
10
1
Yellow
ground
Norite
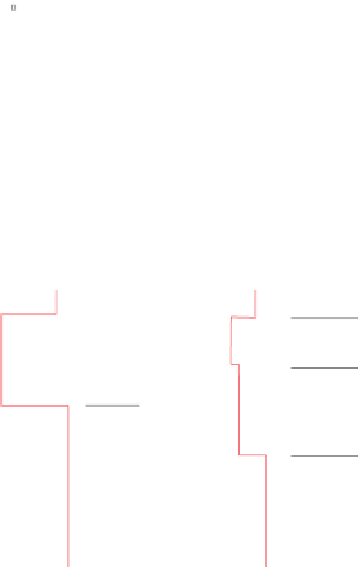
Figure 5.46
Schlumberger array resistivity data from the
Palmietfontein kimberlite pipe. (a) Contours of apparent resistivity
(
10
2
10
2
Serpentinised
blue ground
A
0
and vertical
electrical soundings VES1 and VES32 are shown. (b) Resistivity
profile A
-
A
0
, (c) sounding curves VES1 and VES32 and (d) their
interpretations. See text for details. Based on diagrams in da
Costa (
1989
).
Ω
m) from pro
le surveys. Locations of pro
le A
-
VES32
VES1
10
3
10
3
Depth (m)
Depth (m)


Search WWH ::

Custom Search