Geoscience Reference
In-Depth Information
12 ,------------------------------------------------------------------,
11
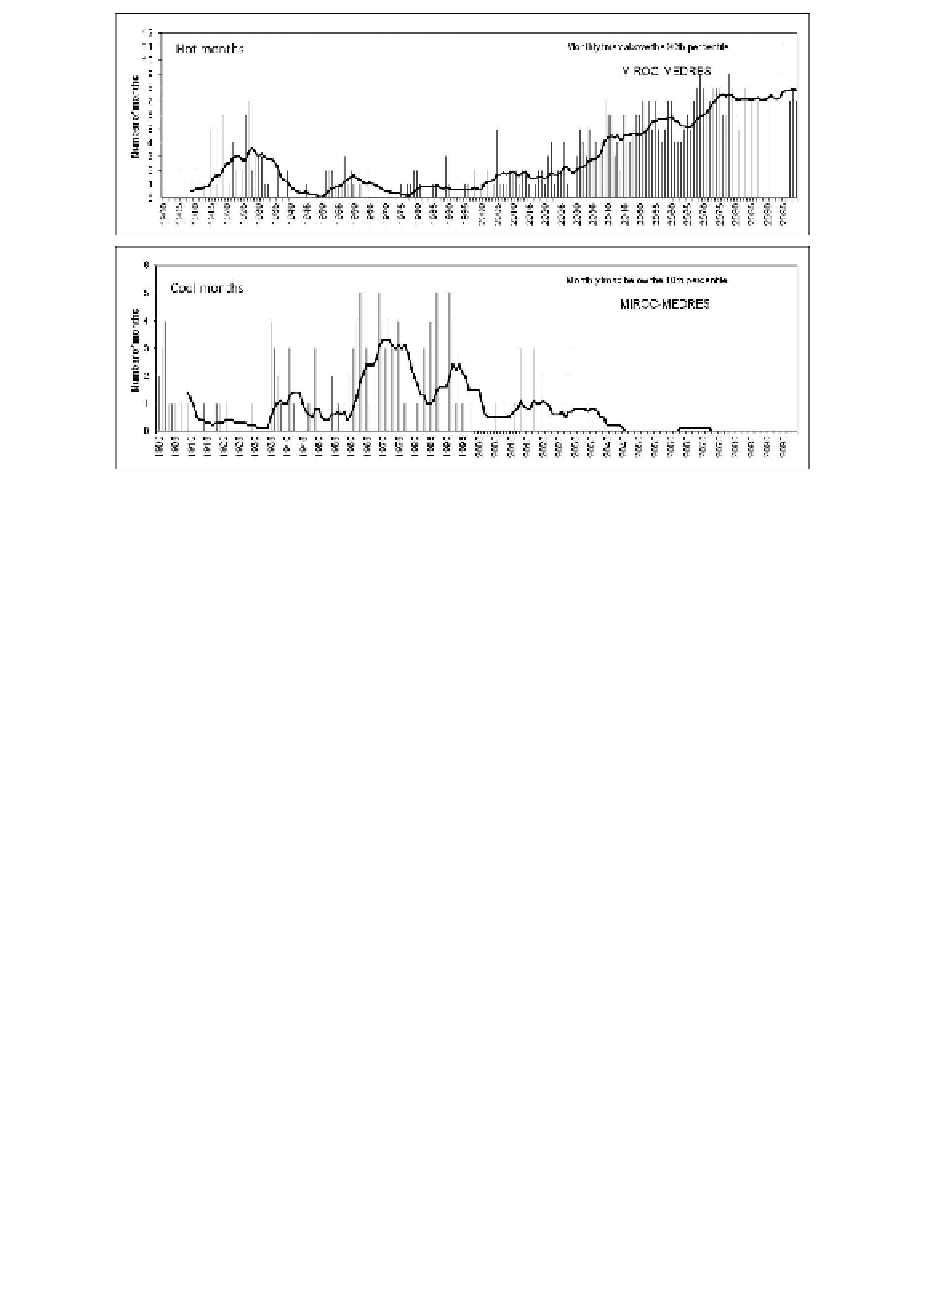
Hot months
Monthlytmax
above the
90th percentile
10
MIROC-MEDR S
1.0
0
1.0
0
1.0
'<t
1.0
1.0
(0
(0
o
0
0
0
0
N
N
N
N
N
N
N
N
N
N
N
Monthlytmax
below the
10th percentile
MIROC-MEDRES
Cool months
Figure 2.4
Annual totals and 11-year moving averages of 1-in-20 year hot or cool
months in south-eastern Australia, modelled for 1910-1999
Notes
a Annual totals (bars); 11-year moving averages (lines).
b The MIROC-MEDRES model exceeds a global warming of 4°C (relative to 1990)
late in the 21st century.
Rainfall change
Global climate models project significant changes in Australian rainfall under
enhanced greenhouse conditions. However, the projected patterns of change
(including areas of increase and decrease) differ considerably between models.
Figure 2.5
indicates the extent to which the climate models agree on the
direction of annual rainfall change over Australia. In the southern third of
continental Australia, at least two thirds of models point toward a decrease in
rainfall, and in the far south west and southernmost parts of the south east, this
trend is evident in 90 per cent of models. Elsewhere (mainly for the summer
rainfall-dominated zone), models range from increase to decrease without a
clear direction of change. A similar analysis by seasons shows that models
disagree about summer and autumn change throughout Australia, but show some
consistency on projected decreases in winter and spring rainfall.
Summer rainfall changes range from
2
50 per cent to
1
50 per cent across most
of Australia. The range is also broad in winter, but in southern areas is skewed