Geoscience Reference
In-Depth Information
18
(a)
17
u
0
16
(J)
~
c
rn
15
OJ
E
rn
14
OJ
>,
6
13
12~~~~~~~~~~~~~-L-L-L-L-L-L~
1900
1950
2000
YEAR
2050
2100
(b)
....... .......... ....... ...
~
2.4
'0
E
-
E 2.2
c.
c
-:~::---------------
....
.-~-------------
2.0
rn
OJ
E
rn
1.8
OJ
>,
6
------------------
'.
1.6
1.4L-L-L-L-L-L-L-L-L-L-L-~~~~~~~~~
1900
1950
2000
YEAR
2050
2100
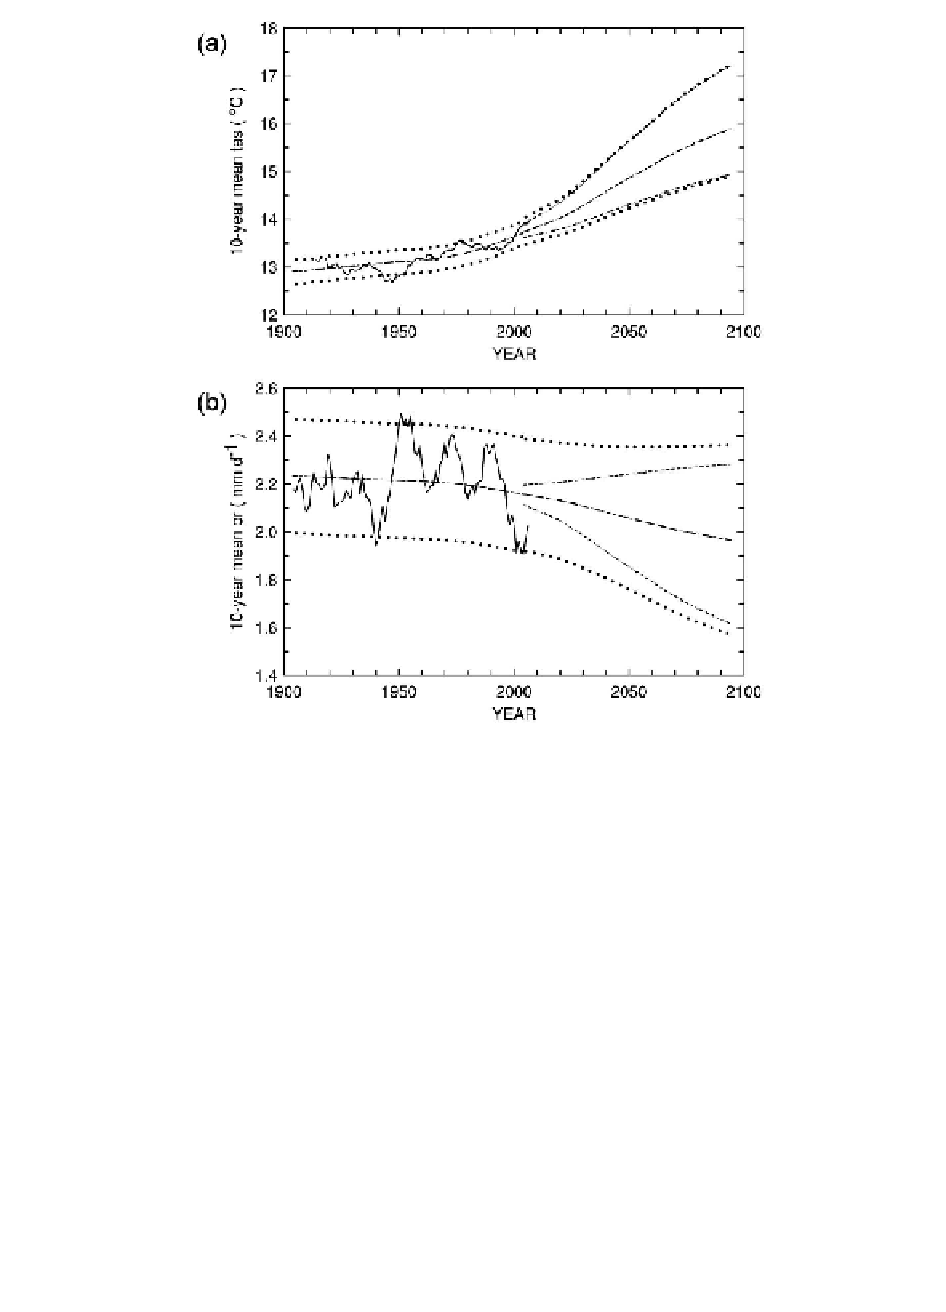
Figure 2.3
Central Victorian temperature (a) and rainfall (b), observed (solid) and
model-based projections
Notes
a Shown are the multi-model median (long dashed line) and the inner envelope (short
dashes) giving the spread of model projections based on the CSIRO&BoM (2007)
projections for a mid emissions scenario.
b The outer envelope allows for decadal scale variability.
c Method of constructing these is described in Watterson and Whetton (2011).
in the frequency of low-temperature extremes. Daily extremes will be considered
in detail in
Chapter 3
, but here we consider the change in occurrence of cool
months and hot months (defined by a 1-in-20 year frequency in the historical
warming by 2100 (see
Figure 2.4
). Cool months are very rare after 2040, and hot
months occur most of the time after 2070.