Geoscience Reference
In-Depth Information
158
208
258
308
358
408
458
110E
120E
130E
140E
150E
.
~
...
------------....................
Likely decrease
Uncertain
Likely increase
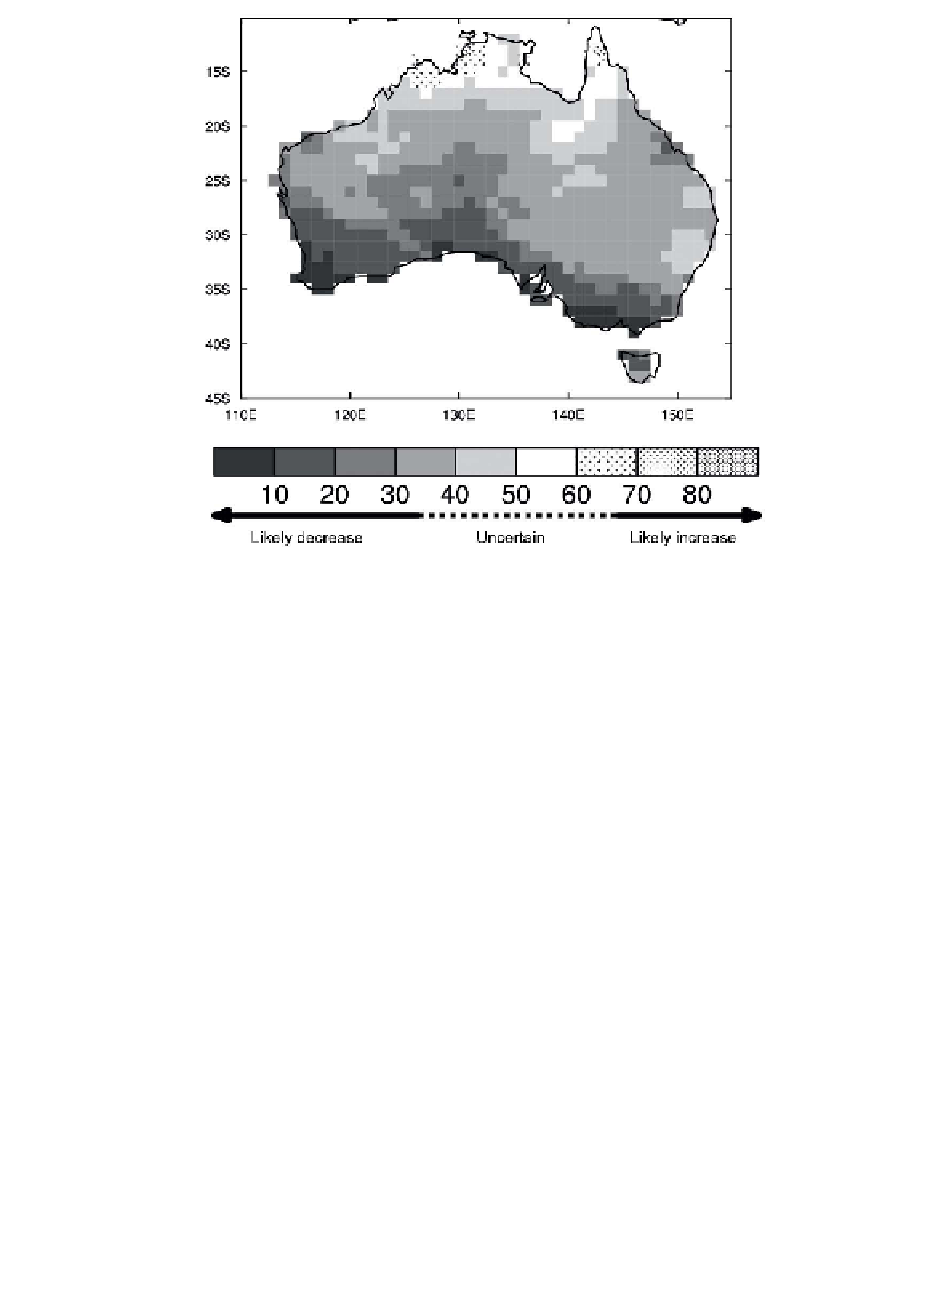
Figure 2.5
Likelihood of increase in annual rainfall across Australia
Note
a As indicated by the fraction of climate model experiments in a multi-model ensemble
showing increase (re-drawn from CSIRO and BoM, 2007).
to decrease and the range is typically around
2
40 to
1
10 per cent. Annual
changes (which factor in rainfall seasonality) can be seen for the selected sites in
The range of change in Perth is from 0 down to
2
50 per cent, Melbourne from
0 down to
2
35 per cent and in Adelaide from
1
5 per cent down to
2
40 per
cent. On the other hand, projected change in Brisbane is from
2
45 to
1
25 per
cent and in Cairns from
2
35 to
1
30 per cent.
In the case of rainfall in Central Victoria (
Figure 2.3b
), the projected changes
(for global warming of around
1
2.8C only, not
1
4°C) are comparable in
magnitude to current decadal variability, and thus may be masked by this varia-
bility for some decades.
These rainfall projections are consistent with the rainfall projections from
the perturbed physics model ensemble (
Figure 2.2
)
, which also show no clear
direction of change in summer rainfall, but a bias to decrease in winter rainfall.
The latter tendency is very strong in the south-west region, where almost none
of the 1,000 simulations considered show an increase in winter rainfall.
In addition to these large ranges of uncertainty in projected rainfall change