Geoscience Reference
In-Depth Information
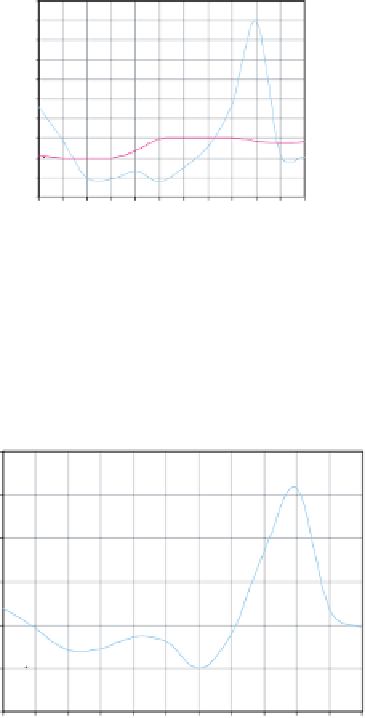
Flow Hydrographs for the Year of Maximum Inflow, 1964
10,000
9,000
8,000
7,000
6,000
5,000
4,000
3,000
2,000
1,000
0
Inflow
Routed Outflow
Actual Outflow
Months
Fig. 12.
Reservoir routing for the year of maximum inflow (1964).
Flow Hydrographs for the Year of Minimum Inflow, 1974
6,000
5,000
4,000
3,000
2,000
1,000
0
Inflow
Routed Outflow
Actual Outflow
Months
Fig. 13.
Reservoir routing for the year of minimum inflow (1974).
of 59 years. This result is similar to that obtained by a previous study on
flooding on Lake Kyoga, which showed that the maximum inflow was about
half of the recurrence interval for the maximum outflow, thereby contribut-
ingtoflooding.
9
Furthermore, the maximum inflow is nearly three times the
maximum outflow. This means that the maximum outflow would probably