Geoscience Reference
In-Depth Information
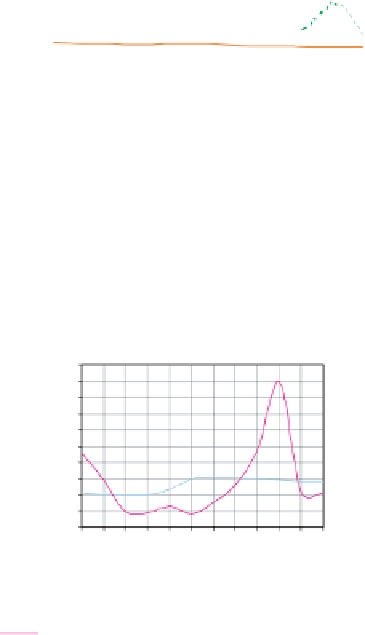
Flow Hydrographs for the Year of Average
Inflow, 1969
3,500
3,000
2,500
2,000
1,500
1,000
500
0
Months
Inflow
Routed Outflow
Actual Outflow
Fig. 10.
Graph of flows for the year of minimum inflow (1974).
Flow Hydrographs for the Year of Maximum
Outflow,1964
10,000
9,000
8,000
7,000
6,000
5,000
4,000
3,000
2,000
1,000
0
Outflow
Routed Inflow
Actual Inflow
Months
Fig. 11.
Reservoir back routing for the maximum outflow (1964).
4. Discussion
From the results obtained, it was established that Kyoga Nile contributes
more than 70% of the inflow to Lake Albert. The implication is that Kyoga
Nile is a key influence of the lake level. This is evidenced by the fact that
the highest effective inflow to Lake Albert occurred at the same time as
the peak discharge of Kyoga Nile. Hence the lake behavior can be pre-
dicted by observing Kyoga Nile discharges. The highest effective inflow of
8,971 cumecs from the data has a recurrence interval of about 28 years. On
the other hand, the highest outflow of 3,029 cumecs had a return period