Geoscience Reference
In-Depth Information
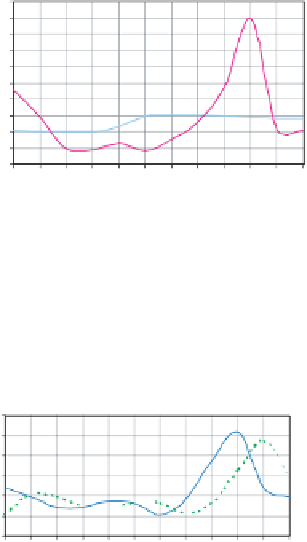
Flow Hydrographs for the Year of Maximum
Outflow,1964
10,000
9,000
8,000
7,000
6,000
5,000
4,000
3,000
2,000
1,000
0
Outflow
Routed Inflow
Actual Inflow
Months
Fig. 8.
Graph of flows for the year of maximum inflow (1964).
Flow Hydrographs for the Year of Minimum
Inflow, 1974
6,000
5,000
4,000
3,000
2,000
1,000
0
Inflow
Routed Outflow
Actual Outflow
Months
Fig. 9.
Graph of flows for the minimum of year of average inflow (1969).
3.2.2.
Reservoir routing
Figures 12-15 show that Lake Albert can be simulated using the reservoir
routing model in attenuating flood peaks. A summary of the results of the
flood routing is shown in Table 4.
3.3.
Flood plain delineation
The demarcation of the flood zones is shown in Fig. 16, gives an indication
of the susceptibility of the flood plain on the Uganda side of the lake, which
is restricted to the Rift Valley floor.