Geoscience Reference
In-Depth Information
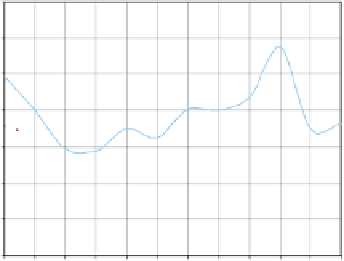
FlowHydrographs for the Year of Average Inflow,1969
3,500
3,000
2,500
2,000
1,500
1,000
500
0
Inflow
Routed Outflow
Actual Outflow
Months
Fig. 14.
Reservoir routing for the year of average inflow (1969).
Table 4.
Summary of flood modeling of the Lake Albert.
Year
Channel routing
Reservoir routing
Maximum inflow, 1964
Poor
Excellent
Maximum outflow, 1964
Poor
Fairly good
Minimum inflow, 1974
Poor
Excellent
Average inflow, 1969
Fairly good
Excellent
200 years (15.80 m)
DRC SIDE
100 years (14.13 m)
25 years (10.79 m)
5 years (6.73 m)
UGANDA SIDE
Fig. 15.
A cross section of Lake Albert showing levels of floods for various return
periods.
occur once in a period during which the maximum inflow has been incident
twice. This is presents a logical hypothesis that the lake floods periodically
partly because the maximum inflow occurs more frequently the maximum
outflow.