Geoscience Reference
In-Depth Information
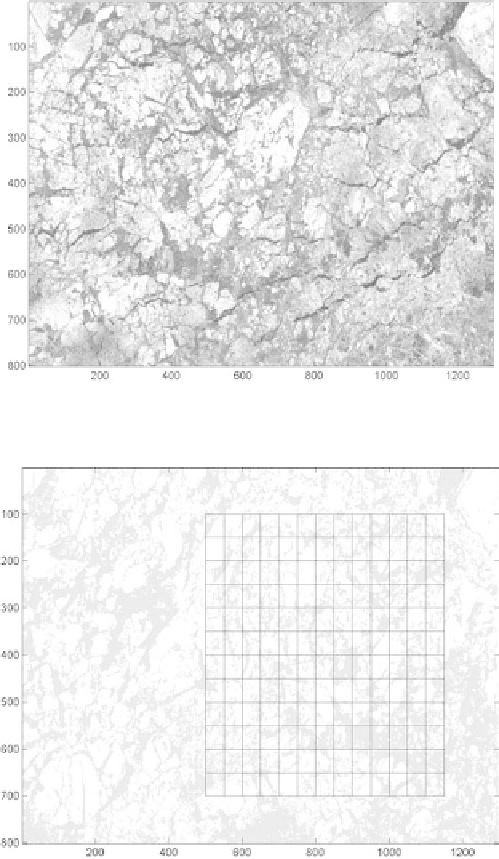
Fig. 3.
SAR data for the cut-out area taken on December 14, 2001.
Fig. 4.
Two-class segmentation result of Fig. 2, with a uniform grid (5 km
×
5km).
from the two-class segmentation results, is used to derive ice motion and
deformation maps. Here, we track a uniform grid (5 km
5km) in Fig. 4
to observe interesting ice deformation behavior in Fig. 5. In Fig. 6, we
show the ice velocities superimposed on the two-class segmentation result
(Fig. 4 without the uniform grid). With the sea ice images well classified,
×