Geoscience Reference
In-Depth Information
transition, since well data has high frequency
content not present in the seismic data. Using
Bayesian reasoning, Buland et al. (
2003
) and
Nair et al. (
2012
) use the following steps:
(i) Assign the elastic properties from well data
as a prior probability model, p(m);
(ii) Treat the seismic AVA data (d) as a likeli-
hood model, p(d|m);
(iii) The Bayesian inversion is then posterior
probability model, p(m|d).
To handle the band-limitations of the seismic
data a low frequency background model is
needed. This is estimated from vertical and lat-
eral trends in the well log data using Kriging to
generate a smoothed background model. This
background model itself should capture the
underlying geological concepts (sand fairways,
porosity trends) but is also critical to the seismic
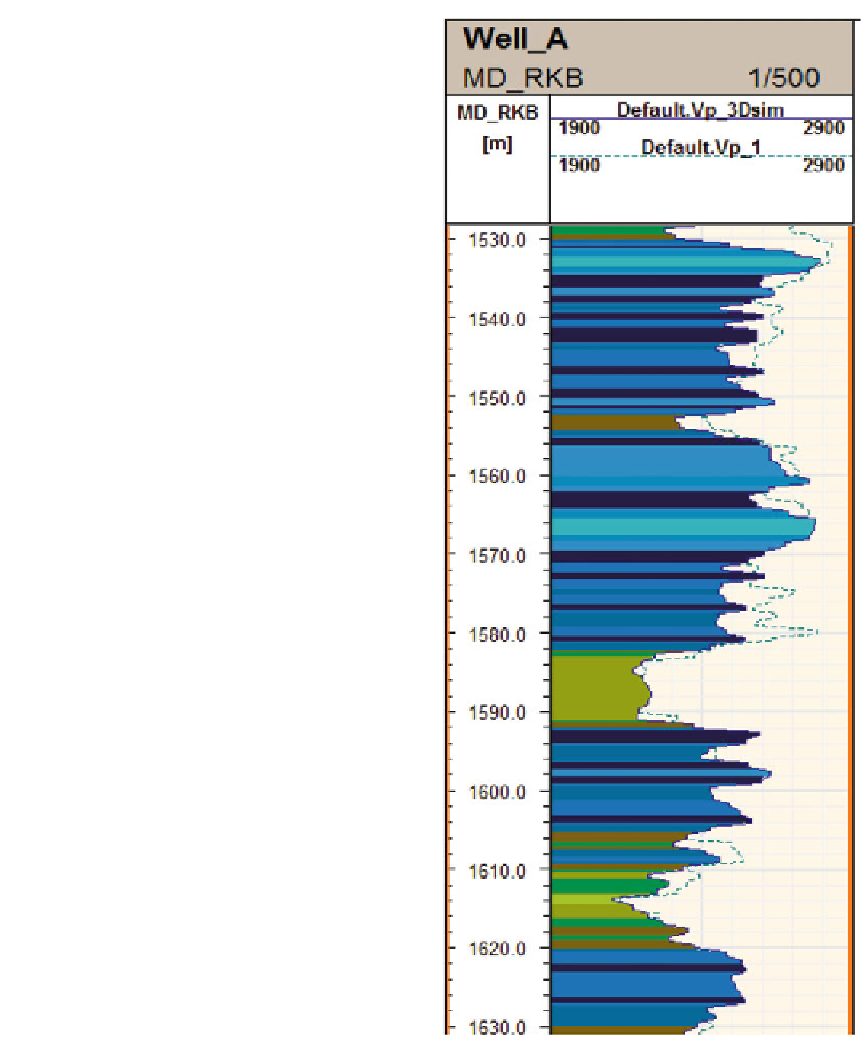
inversion. Figure
3.26
shows an example com-
parison of raw versus inverted V
p
logs, an impor-
tant step in quality control of the process.
The solutions to seismic AVA inversion are
non-unique and entail large amounts of data
- wavelets and reflection coefficients for each
offset angle throughout the volume of interest.
By transferring the data into the Fourier domain
(the frequency spectrum), Buland et al. (
2003
)
used a fast Fourier transform to handle the seis-
mic covariance matrices and to separate the sig-
nal and noise terms. Figure
3.27
compares AI
from seismic inversion (the prediction) with
two stochastic realisations of simulated AI,
incorporating both seismic data and well data.
Notice the finer resolution of simulated cases
because of inclusion of higher frequency well
data with the seismic data in this Bayesian
workflow.
The potential for deriving rock properties
from seismic data is enormous. The V
p
/V
s
versus
impedance plot (e.g. Fig.
3.28
) is widely used as
a rock physics template, giving the potential for
estimation of facies and flow properties from
seismic data. Exactly how successfully this can
be done depends on the case at hand and the data
quality. We should add a cautionary reminder to
seismic inversion enthusiasts - the transform
from elastic properties to flow properties is not
a simple one, and there are many pitfalls. How-
ever, in the hands of an experienced reservoir
Fig. 3.26
Comparison of raw V
p
logs (
dashed lines
) with
V
p
logs extracted along the well from the inverted 3D seismic
data (
continuous lines
), from Nair et al. (
2012
)(Redrawn
from Nair et al. 2012,
#
EAGE reproduced with kind
permission of EAGE Publications B.V., The Netherlands)
modeller the Bayesian statistical framework
offers a rather elegant way of making that leap
from 3D seismic data to predictive flow property
models.