Database Reference
In-Depth Information
SIDEBAR: KEEP TRACK OF TASK-COMPLETION PAIRED RESULTS!
The reason the two data sets differ in terms of the appropriate measure of Cochran's Q is subtle,
but was true also in the paired t-test of Chapter 3. Even though in both cases it is a 7/3 versus 5/5,
in the (A, B) data set, only 2 people differed in their result for the two tasks, persons 6 and 7; the
remaining 8 people performed the same way. However, in the (E, F) data set, 8 of the 10 people had
a different result. It could have been many different patterns. These differences are relevant when
computing the probability that such a result could arise due to luck, basically, the
p
-value.
In essence, we must know the paired results, and not only the number of passes and fails. This
was not true when we had independent samples, but is, unfortunately, true for within-sample/paired
data studies.
The moral of the story is to keep track of your task completions/failures during your testing for
each participant. This can get a little tricky when you've counterbalanced the tasks to ameliorate a
potential “order effect.”
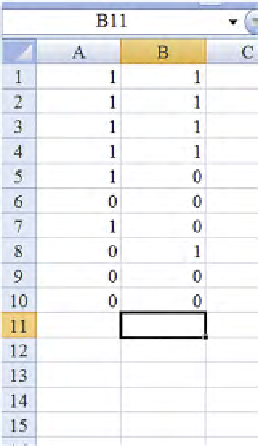
Now, let's look at the values in
Figure 5.2
, which displays the pass/fail pattern
you observed during your test.
Now, to perform the Cochran Q test, we need to do various calculations, but doing
calculations are what Excel excels at (pun intended!). Here are the steps:
Step (1)
Total each column, obtaining the 6 and 5 we knew about from our
test data. This is easily done using the SUM command. For column 1, we type
“=SUM(A1:A10),” where we enter the command, arbitrarily in cell A12. Then we
press enter. Do this similarly for column B. The result is shown in
Figure 5.3
.
FIGURE 5.2
Detailed pass/fail data of our earlier listed two-task hypotheses; Excel.


Search WWH ::

Custom Search