Database Reference
In-Depth Information
where p5 and p8 are the true proportions of successful completions for tasks 5 and
8, respectively, in
Table 5.1
. (As a reminder: Task 5 involves getting on the waiting
list, and Task 8 involves re-registering for a course.) As we have said
ad ininitum,
the true value of this proportion is that which would result if the entire population
who could ever be performing the task indeed performed the task. We can sum up the
sample results in
Table 5.2
.
As we see in
Table 5.2
, task 5 had six successful completions and four failures,
while task 8 had ive successful completions and ive failures.
5.3.1
EXCEL
To perform the Cochran Q test, it is not suficient to simply provide the values we
have in
Table 5.2
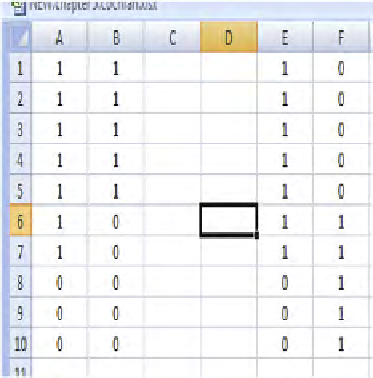
. When we have a within-subject design it is important to know
the paired results of the proportions. Consider the pass/fail data for two tasks (in a
ictional test) such as in
Figure 5.1
. The data in columns A and B are not the same as
the data in columns E and F, even though in both cases we are comparing a 7/3 pass
rate with a 5/5 pass rate.
Table 5.2
Data/Frequencies for Hypothesis Test
Task
5
8
Pass
6
5
Fail
4
5
FIGURE 5.1
Two different 7/3 versus 5/5 patterns; Excel.


Search WWH ::

Custom Search