Image Processing Reference
In-Depth Information
based on their contrast by seting a lower value in the threshold. The system detects fewer cells
The final stage is the segmentation process, which displays the input image with all the con-
toured benign (gray) and distorted (dark gray) RBCs. Through this operation, the area, convex
area, perimeter, and eccentricities for each cell are measured. In addition, the good and dis-
torted cells can be counted, and the patient can be diagnosed with sickle-cell anemia. These
measures are used as input variables to train the NN and C&R tree; but the output (target)
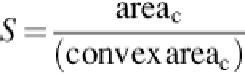
measured based on the solidity (S), which it is the area of cell divided by its convex area, as in
(4)
(5)
where area
c
is the area in each cell, and convex area
c
represents its convex area for all detected
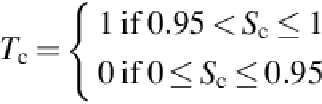
cells (benign and distorted). The target
T
c
can have two values, 1 and 0, based on the solution
of Equation
(4)
. As a result, if any solidity value
S
c
is > 0.95 up to 1 (perfect cell),
T
c
takes the
value 1 with the decision benign. On the other hand, if
T
c
takes the value 0, then the
S
c
value is
The back-propagation NN has been trained and tested using 4 variables as an input layer,
10 neurons in the hidden layer, and 1 neuron in the output layer. Moreover, three kinds of
samples are applied: training, validation, and testing samples. The samples are presented in
the network during the training process by 80% and 20% for testing process, and the network
is modified according to the error. Accordingly, only 10% are used for the validation samples
to measure network generalization and to pause training when generalization stops improv-
ing. The remaining 10% of all cell samples are introduced as a testing sample that has no effect
on training and thus provides an independent measure of network performance during and
after training. In addition, the mean square error (MSE) is applied, with the MSE defined as
the average squared difference between outputs and targets. For the MSE, lower values are
better, and zero means no error.
Table 1
illustrates the description of the formed cells' data,
which is automatically computed for all cells (benign and distorted).
Search WWH ::

Custom Search