Travel Reference
In-Depth Information
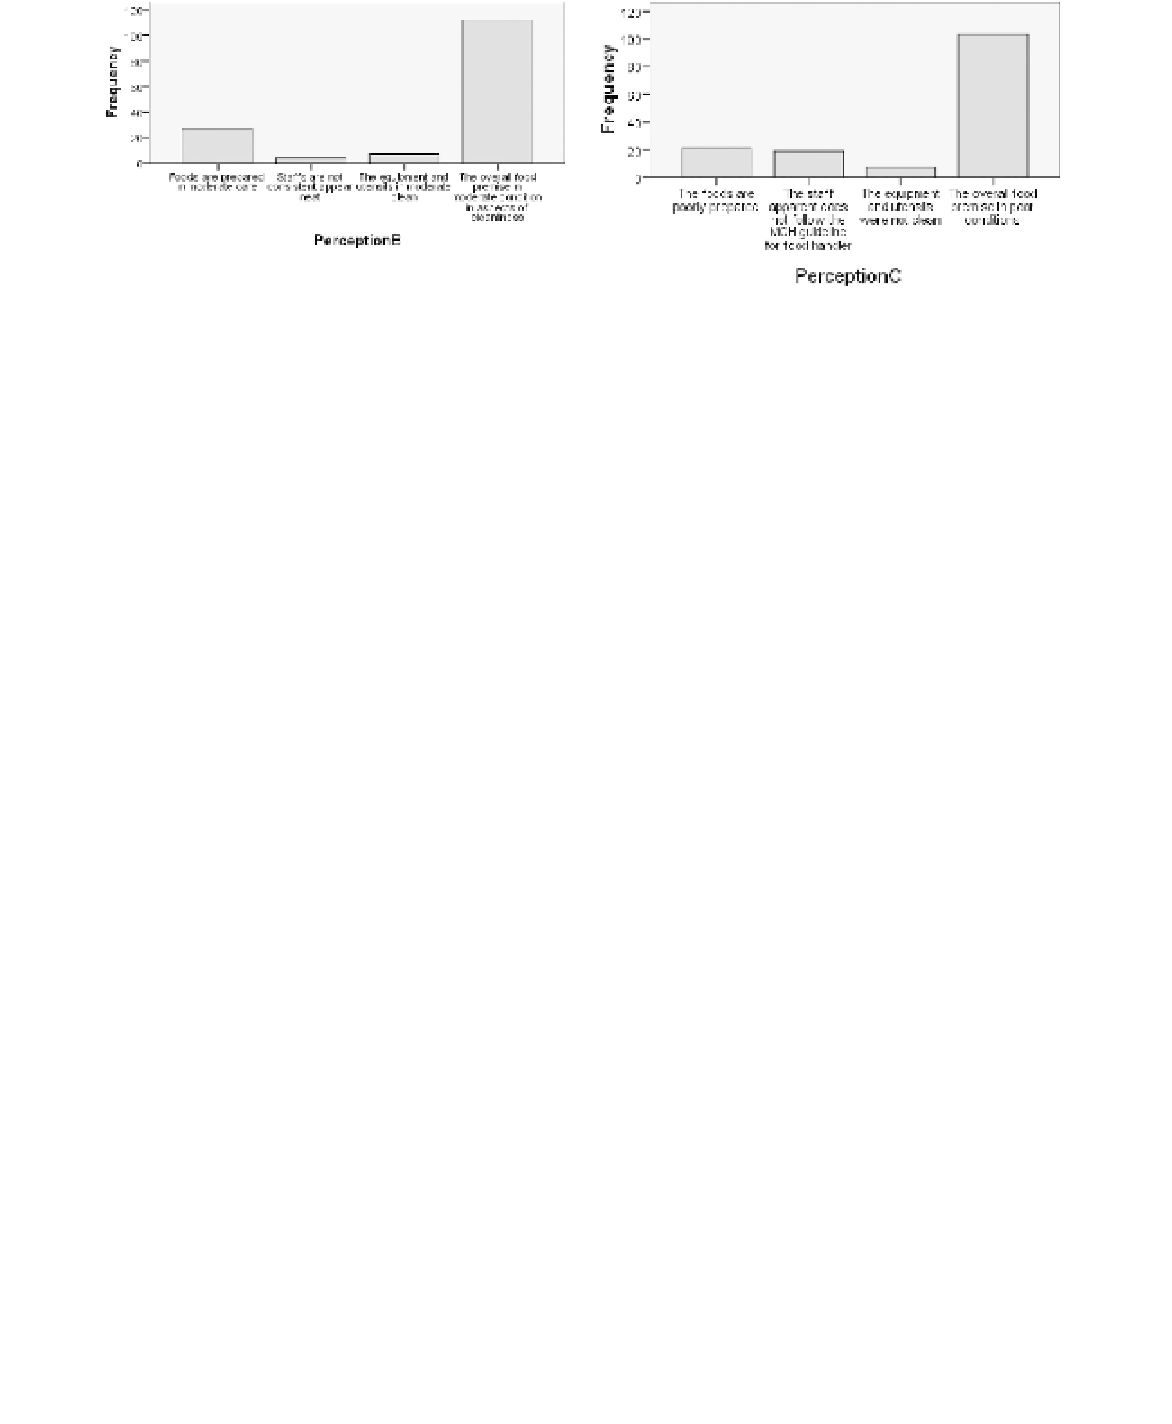
Figure 4. Perception about food premises that have
Grade B.
Figure 5. Perception about Food Premises that have
Grade 'C'.
said that the food was prepared more carefully
and 13 of them stated that the equipment and
utensils were kept clean all the time. Lastly, only
seven of them said that the staff or food handler
was always appeared neat. The mean score for this
question is (M
female, only 49 respondents said that they have
seen the label. The total respondents said yes are
79 respondents are equal to 52.7 percent. Other
than that, 15 male and 18 female respondents said
that they are not sure which equal to 22 percent
are about 10 respondents for male and 17 respond-
ent for female which made up 18 percent from the
overall percentage. Lastly, for the respondent whom
answers those do not know are about 7.3 percent,
which include 2 male and 9 female respondents.
=
3.44) while for standard deviation
is (e
2
=
1.052).
4.6
Perception about food premises that have
Grade 'B'
Next, for question about “your perception on
Grade 'B', most of the respondent (n
112) said
that if the food premises have 'B' grade, meaning
that the overall food premises in moderate con-
dition in aspects of cleanliness. Other than that,
(v
=
4.8
Food premise grading system: Consumer
perception
In this study, the consumer perception on the food
premise grading system which is they are dependent
on the food premise grades 'A', 'B' or 'C' as a guide
in selecting the food premise is slightly different of
the distribution agreement between agree and disa-
gree. The agreed respondent was highest which is
34.7 percent (n
27) said that the food were prepared in mod-
erate care and (v
=
7) stated that the equipment
and utensils in moderate cleanliness. Lastly, only
a few of the respondents (v
=
4) said that the staff
or food handler does not appear neat consistently.
The mean score for this question is (M
=
=
3.36)
while for standard deviation is (e
2
=
1. 172).
=
52), strongly agreed 11.3 percent
(n
17), followed with total of disagreed 28.7 per-
cent (n
=
38).
Majority of the respondents agreed with the
statement of grades 'A', 'B' or 'C' of food premises
show the level of cleanliness and safety. The total
of agreed respondents was 87.3 percent (n
=
43) and neutral 25.3 percent (n
=
4.7
Perception about food premises that received
'C' Grade
For question about “your perception on Grade
'C', most of the respondent (v
103) said that if
the food premises have 'C' grade, meaning that the
overall food premises is in poor conditions. Other
than that, (v
=
131).
In this study, cross tabulation analysis revealed
that the relationship between demographic which
is level of age between the consumer's understand-
ing and concern about food premise grading sys-
tem is shown that there are about half of the total
respondents which are 72 respondents agreed on
the statement. They are from the age of 21 to 25
(24 respondents), from age of 26 to 30 (20 respond-
ents) and the rest from other level of age. While,
about 27 respondents were disagreed on that state-
ment and 51 respondents were neutral.
=
21) said that the food are poorly
prepared and (v
=
19) stated that the staff appar-
ent does not follow the MOH guideline for food
handler. Lastly, a few respondents (v
=
7) said that
the equipment and utensils were not clean. The
mean score for this question is (M
=
=
3.28) while for
standard deviation is (e
2
1.142).
Only 30 male said that they see the label 'A', 'B',
'C' or 'D' at the food premises. Meanwhile for the
=


Search WWH ::

Custom Search