Information Technology Reference
In-Depth Information
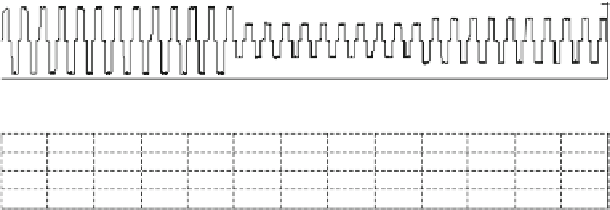
Load Current (Phase A)
20
0
-20
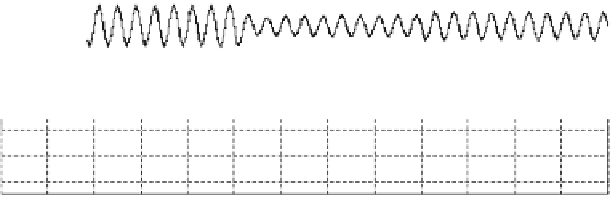
Source Current (Phase A)
40
20
0
-20
-40
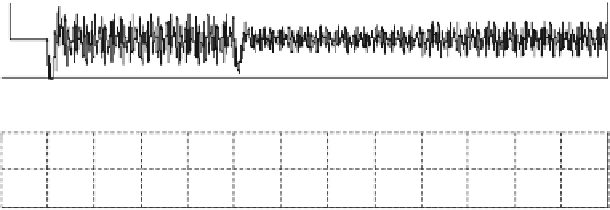
Filter Current (Phase A)
10
0
-10
DC Link Voltage & Ref. Voltage
700
680
660
0
0.05
0.1
0.15
0.2
0.25
0.3
0.35
0.4
0.45
0.5
0.55
0.6
0.65
Time (sec)
Fig. 15 Dynamic response of shunt APF with 49-rule FLC using Dsig MFs
Table 3 Dynamic response of shunt APF controlled by 49-rule FLC with different membership
functions
Load
% peak overshoot/under-shoot
Settling time (cycles)
Triangular
MFs
Gbell
MFs
Gaussian
MFs
Dsig
MF
Triangular
MFs
Gbell
MFs
Gaussian
MFs
Dsig
MF
Case-1
1.32
0.51
0.05
1.81
2.0
0.92
1.45
-
Case-2
2.05
2.35
2.29
2.28
1.80
2.49
1.86
2.19
Case-3
1.17
1.44
1.32
1.40
0.47
0.59
0.42
0.47
quantitative indices. These indices are termed as performance indices and are used
for parameter optimization of a control system resulting in the design of optimum
control system. In optimum control system, the systems parameters are adjusted
such that the error between the reference and actual output is minimized and
performance index reaches an extreme, commonly a minimum value. The com-
monly used performance indices (Nagrath and Gopal
2005
) are listed below and
their comparison for different controllers is presented in Table
4
.


Search WWH ::

Custom Search