Graphics Reference
In-Depth Information
Figure
.
.
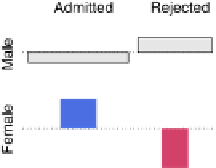
Conditional association plot for the UCB admissions data. For each individual association
plot, rows correspond to gender and columns to admission
and admission, given department), stratified by department. Clearly, the situation in
department A (more women/less men admitted than expected under the null hy-
pothesis) results in the rejection of the hypothesis of conditional independence. In
Fig.
.
, data-driven cut-offs (derived from the maximum test for conditional in-
dependence) are used, resulting in more colorful shading than the fixed cut-offs in
Figs.
.
and
.
.
AFour-WayExample
12.4.3
As a four-wayexample, we usethe punishment data (Andersen,
)froma study of
theGallup Institute inDenmarkin
regarding theattitude ofarandomsample of
peopletowardscorporalpunishmentofchildren(seeTable
.
).hedata consist
offourvariables. Attitude isabinaryvariable indicating whetherapersonapprovesof
moderatepunishmentofchildren(“moderate”),ordisapprovesofanypunishmentof
children (“no”). Memory indicates whether the person recalls having been punished
as a child. Education indicates the highest level of education (elementary, secondary,
high). Finally, age indicates the age group in years (
-
,
-
,
).
In a first step, we create a mosaicplot for an exploratory view of the data: atti-
tude towards punishment is clearly the response variable here and should be used
for the last split via highlighting. Furthermore, we expect age and education to have
an influence on both memory and attitude, so they should be used first for splitting
as stratifying variables. In fact, the question is whether memory has some influence
on attitude, given age and education. We choose to create a three-way mosaicplot of
the hypothesized explanatory variables (first splitting horizontally by age, then ver-
tically by education, and finally horizontally again by memory), and to have attitude,
+