Graphics Reference
In-Depth Information
Figure
.
.
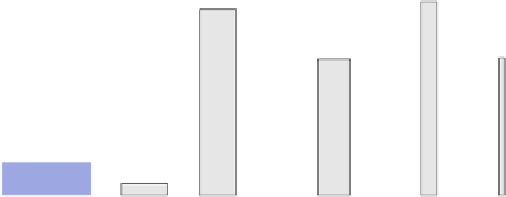
Mosaic plot for the UCB admissions data.
Figure
.
.
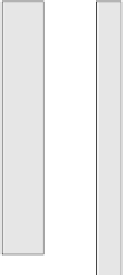
Association plot for the UCB admissions data.
terpretthe dependent variables of interest. Particularly for very unevenly distributed
marginals, the strata can become very distorted, and the tiles, along with their shad-
ings, can become inscrutable. One alternative is to complement the conditioning in
the model with conditioning in the plot; i.e., to use trellis-like layouts to visualize
partial tables as defined by the conditioning variables. All subtables are corrected
for marginals, and thus all corresponding plots in the panels are of the same size. In
addition, trellis layouts helptoreduce thecomplexity of biggertables. Figure
.
vi-
sualizes the data by means of a conditional association plot. Each panel corresponds
to a department, and contains an association plot corresponding tothe partial (four-
fold)table of admission andgender. Accordingly, the shading visualizes the residuals
from the corresponding conditional independence model (independence of gender