Chemistry Reference
In-Depth Information
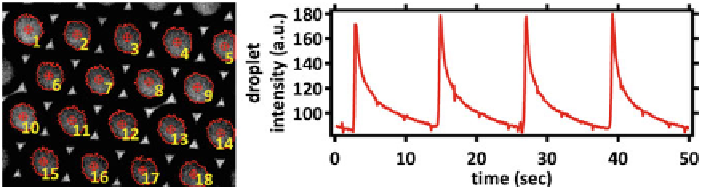
Fig. 5.3
Image processing to identify the droplet oscillators and record their dynamics
available Nano-protect coat. The 2d array is created between two hydrophobised
glass slides with a PDMS spacer. The reaction dynamics are recorded by video
microscopy on an inverted microscope (Olympus IX 81) through an appropriate
optical filter. As described earlier, the BZ reaction dynamics can be followed by
the colour of the catalyst as it changes from red to blue and vice versa. The optical
filter we chose is therefore a notch filter of 480/20 nm wavelength such that the red
colour of the catalyst has less transmittance through the filter. Droplets are identified
from the recorded images using Image-Pro Plus (Media Cybernetics) as shown in
Fig.
5.3
(left panel). The BZ oscillations within the droplet are then identified by
measuring the mean intensity value of the droplet. The temporal BZ oscillations are
then seen are traces similar to those of a relaxation oscillator as seen in the right
panel of Fig.
5.3
. The sudden rise of intensity corresponds to the autocatalytic cycle
of the BZ reaction with the catalyst changing from red to blue colour and the gradual
fall in intensity corresponds to the gradual release of bromine in the reaction and
the changing back of the catalyst colour from blue to red. Further analysis on the
obtained data as described in the results section is done using MATLAB.
5.3 Results
5.3.1 Isolated BZ Oscillators
The BZ oscillators described here are a closed reactor system i.e. there is no mass
flux during the reaction. Therefore all the reactants and the resultant products remain
within the droplet. As a result, the nature of the oscillations gradually changes with
time. As soon as the experiment is started, the oscillation is set by the initial reac-
tion conditions and the amplitude of the oscillations and the frequency change as
time proceeds. This can be seen in Fig.
5.4
. As time proceeds, the amplitude of the
oscillations reduces significantly till they die out completely. The frequency of the
oscillation, shown in black, gradually reduces. However, over the duration of the
experiment, the frequency reduces to only with a few percent (in this case 10%, over
the observation of 50 oscillation cycles) and for the studies made in this work, can