Chemistry Reference
In-Depth Information
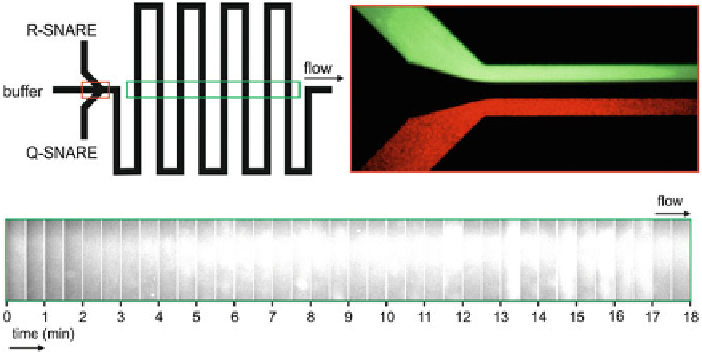
Fig. 3.5
Channel geometry of a microfluidic device for membrane fusion.
To p l e f t
It consists
of a cross geometry when the two SNARE populations are mixed.
Top right
Mixing of SNARE
liposome populations is achieved by hydrodynamic flow focussing.
Bottom
Images of the acceptor
flourescence in the different turn segments of the channel are recorded as shown. The fusion is
monitored by recording the average intensity of each time window. It can be clearly seen that as
time proceeds (i.e. in the direction of the flow), the brightness of the images increases. This is due
to the increase in the FRET signal that follows the fusion event
A microfluidic device geometry as shown in the top left panel of Fig.
3.5
is used
to mix the two SNARE populations on the chip. A cross channel geometry where
flow can be focussed is a well known method to provide controlled mixing on a
microfluidic chip as shown in the top right panel of Fig.
3.5
. The well controlled flow
rates in the channel can be used to provide a precise calibration of time along the
length of the channel, i.e., the length along the channel at which the two SNARE
populations first come into contact is regarded as t
0 and time proceeds linearly
along the channel length. Therefore one can take snapshots of the fluorescence inten-
sity at various points along the length of the channel as shown in the bottom panel
of Fig.
3.5
. When the intensity of the recorded images is plotted as a function of the
length of the channel i.e. time, the changes in fluorescence intensity and thus the
FRET signal due to the membrane fusion can be reconstructed as shown in Fig.
3.6
.
Each of these liposome populations were flown through the microfluidic device
and the resulting donor fluorescence was recorded as described earlier. The microflu-
idic channel had a cross sectional area of 0.025mm
2
and length of 445.5mm. There
are 40 'turns' in the channel and each turn segment provides one time window at
which the images are recorded. For different volumetric flow rates in the channel, the
reaction time point changes along the channel linearly with the flow rate. Figure
3.6
shows fluorescence of the acceptor fluorophore as a function of the reaction time
along the channel at different flow rates. As expected, when the fusion of the mem-
branes occurs, the fluorescence of the acceptor increases as seen. Further, when we
control the flow rate and thus the time points along the channel, we see the linear
=