Chemistry Reference
In-Depth Information
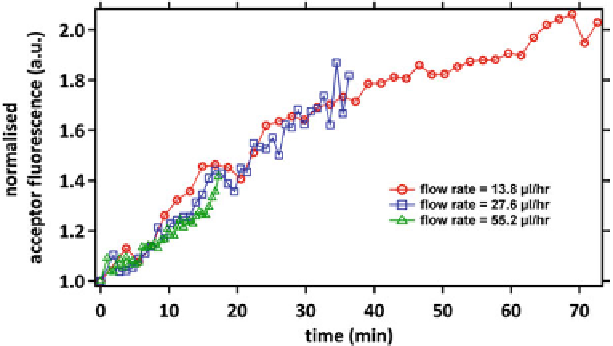
Fig. 3.6
Flow rate control of time axis in the microfluidics experiments. As we increase the flow
rate, thus shortening the time along the channel, we see that the fusion of the membranes proceeds
only until that time point (
green curve
). We then see that these time points depend linearly on the
flow rate within the channel
dependance of the reaction time on the volumetric flow rate in the channel. The donor
fluorophore shows a corresponding drop in fluorescence intensity due to the FRET
coupling. The fusion kinetics are similar to those in measurements in bulk and thus
the microfluidic technique forms a reliable platform to carry out fusion experiments.
Furthermore, a controlled
Ca
2
+
trigger can be provided by introducing an appropri-
ate side channel in the microfluidic network at the required distance along the main
reaction channel.
In the next sections, using an appropriate combination of microfluidic and
bulk experiments, the electrostatic interactions and the role of the
Ca
2
+
trigger
synaptotagmin-1 are further investigated.
3.3 Results
3.3.1 Electrostatic Repulsion Blocks Membrane Fusion
As we mentioned before, SNARE mediated liposome fusion is typically studied
at physiological ionic strength, with NaCl or KCl concentrations ranging between
100 and 150mM. At these salt concentrations, the debye charge screening length is
typically only
7Å. Therefore, molecules need to be within a few times this distance
to interact via charge effects. First, we study the effect of lowering the ionic strength of
the buffer solution, on SNARE-mediated fusion, in the absence of synaptotagmin-1.
This is measured by employing the FRET-based lipid mixing assay described above.
∼