Graphics Reference
In-Depth Information
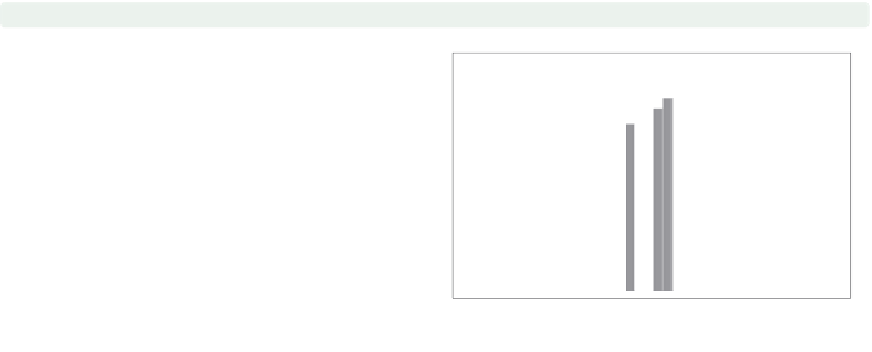
twoway bar close tradeday
Consider this bar chart, which shows
the closing prices of the S&P 500
broken down by the trading day of the
year.
Uses spjanfeb2001.dta & scheme
vg s1m
0
10
20
30
40
Trading day number
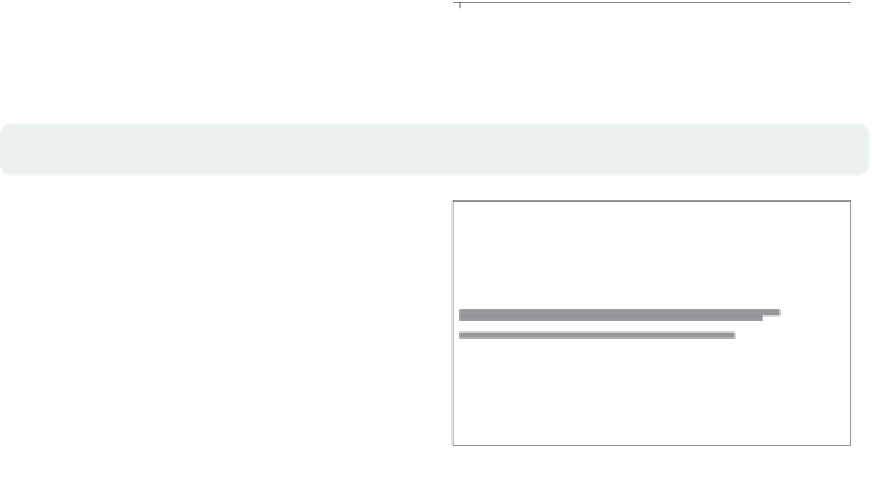
twoway bar close tradeday,
horizontal
xtitle(Title for x-axis) ytitle(Title for y-axis)
We can make the
close
and
tradeday
variables trade places with the
horizontal
option. Note that the
x
-axis still remains at the bottom and
the
-axis still remains at the left.
Uses spjanfeb2001.dta & scheme
vg s1m
y
1250
1300
1350
1400
Title for x−axis
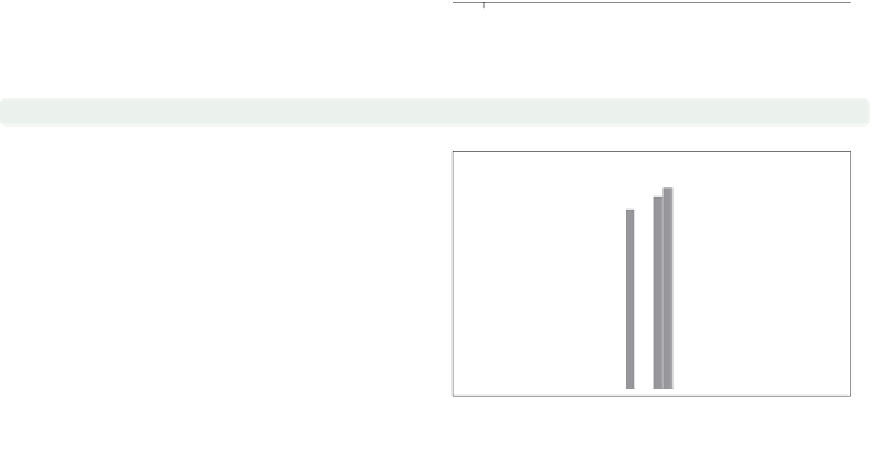
twoway bar close tradeday,
base(1200)
Unless we specify otherwise, the base
forthebarchartsisthetradingday
with the lowest price. In this example,
the closing price on day 40 was 1239.94,
so unless we specify the
base()
option,
the base would be 1239.94. As a result,
the bar for day 40 would have a zero
height. Here, we change the base to
1200 to give this bar a height.
Uses spjanfeb2001.dta & scheme
vg s1m
0
10
20
30
40
Trading day number
The electronic form of this topic is solely for direct use at UCLA and only by faculty, students, and staff of UCLA.