Graphics Reference
In-Depth Information
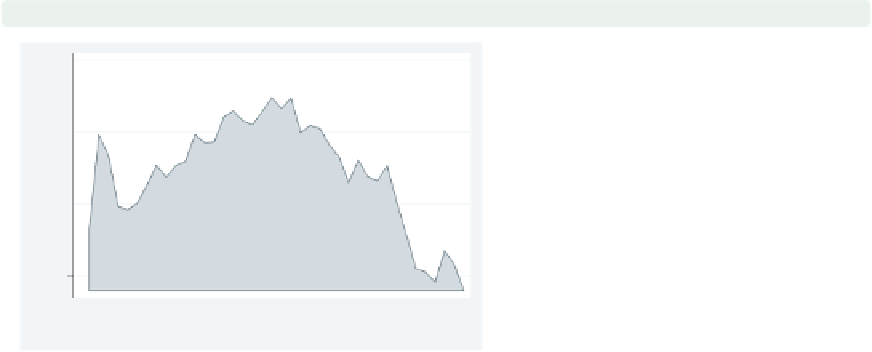
twoway area close tradeday, sort
base(1320.28)
You can use the
base()
option to
indicate a base from which the area is
to be shaded. In this example, the base
is the closing price on the first trading
day, and thus all the subsequent points
are a kind of deviation from the first
day's closing price.
Uses spjanfeb2001.dta & scheme
vg palec
0
10
20
30
40
Trading day number
twoway area close tradeday, sort
bcolor(emerald)
The
bcolor()
option sets the color of
the shaded area and the line. Here, we
make the shaded area and line emerald.
Although it is not shown, you can also
use the
bfcolor()
and
blcolor()
options to control the fill color and line
color and the
blwidth()
option to
control the thickness of the outline.
Uses spjanfeb2001.dta & scheme
vg palec
0
10
20
30
40
Trading day number
2.6
Bar plots
This section illustrates the use of twoway bar graphs using
twoway bar
. These graphs
show a bar for each
x
-value where the height of the bar corresponds to the value of the
y
-variable. For more details, see [
G
]
graph twoway bar
. We will continue to use the
spjanfeb2001
data file, which has the prices for the S&P 500 index for January and Febru-
ary, 2001, but show the graphs using the
vg s1m
scheme.
twoway bar
is useful for creating
bar graphs with overlays of lines, points, or other plot types and can be useful with evenly
spaced
x
-variable data.
graph bar
is more useful for creating bar graphs with categorical
data.
The electronic form of this topic is solely for direct use at UCLA and only by faculty, students, and staff of UCLA.