Graphics Reference
In-Depth Information
twoway bar close tradeday,
barwidth(.7)
Unless otherwise specified, the width of
each bar is one
-unit (in this case, one
day). By making the width of the bars
.7, we can obtain a small gap between
the bars.
Uses spjanfeb2001.dta & scheme
vg s1m
x
0
10
20
30
40
Trading day number
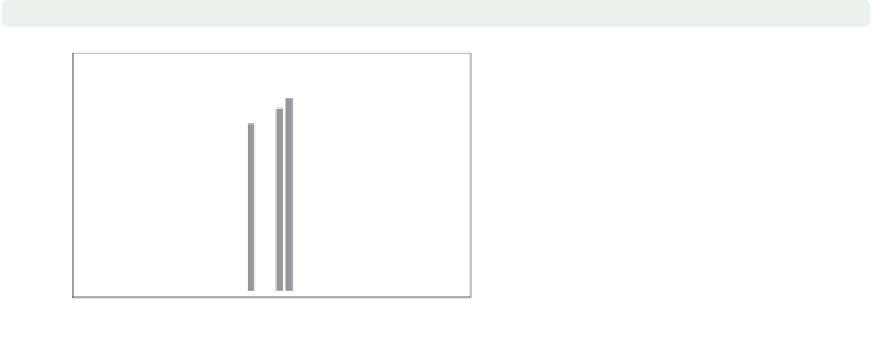
twoway bar close tradeday,
bfcolor(gs15) blcolor(gs5)
We can use the
bfcolor()
(bar fill
color) option to set the color of the
inside of the bars and the
blcolor
(bar
line color) option to set the color of the
bar outlines. Here, we make the bars
light gray on the inside and dark gray
on the outside. See
Styles : Colors
(328)
for more colors you can choose.
Uses spjanfeb2001.dta & scheme
vg s1m
0
10
20
30
40
Trading day number
2.7
Range plots
This section focuses on twoway commands that display range plots. The major charac-
teristic these graphs share is that, for each
x
-value, there are two corresponding
y
-values. A
common example is a confidence interval where, for each
-value, there are upper and lower
confidence limits. We first show examples of all of these types of graphs and then consider
the options that can be used to customize them. For more information, see [
G
]
graph
twoway rarea
,[
G
]
graph twoway rbar
,[
G
]
graph twoway rspike
,[
G
]
graph twoway
rcap
,[
G
]
graph twoway rcapsym
,[
G
]
graph twoway rscatter
,[
G
]
graph twoway
rline
, and [
G
]
graph twoway rconnected
. We will start by looking at the
rconnected
,
rscatter
,
rline
,and
rarea
graphs, which use combinations of lines, symbols, and shading
to display range plots. These examples use the
spjanfeb2001
data file.
x
The electronic form of this topic is solely for direct use at UCLA and only by faculty, students, and staff of UCLA.