Graphics Reference
In-Depth Information
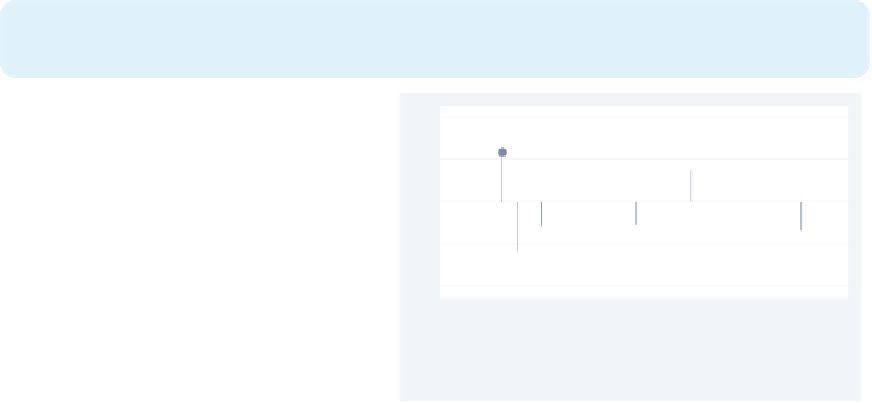
twoway (dropline DFpropval100 id if abs(DFpropval100)>.25, mlabel(stateab))
(dropline DFworkers2 id if abs(DFworkers2)>.25, mlabel(stateab))
(dropline DFurban id if abs(DFurban)>.25, mlabel(stateab))
This example is similar to the one above
but simplifies the graph by showing
only the points where the
DFBETA
exceeds .25. Note that we have taken
the example from above and converted
it into three overlaid
dropline
plots,
each of which has an
if
condition.
Uses allstates.dta & scheme vg s2c
DC
CT
MN
NJ
UT
MN
NV
HI
UT
DC
AK
DC
0
10
20
30
40
50
id
Dfbeta propval100
Dfbeta workers2
Dfbeta urban
Before making the next graph, we need to issue three
predict
commands to generate
variables that contain the Cook's distance, the studentized residual, and the leverage based
on the previous regression command:
. predict cd, cook
. predict rs, rstudent
. predict l, leverage
We are then ready to run the next graph.
twoway (scatter rs id) (scatter rs id if abs(rs) > 2, mlabel(stateab)),
legend(off)
This graph uses
scatter rs id
to
make an index plot of the studentized
residuals. It also overlays a second
scatter
command with an
if
condition showing only studentized
residuals that have an absolute value
exceeding 2 and showing the labels for
those observations. Using the
vg samec
scheme makes the markers the same for
both
scatter
commands.
Uses allstates.dta & scheme vg samec
AK
DC
0
10
20
30
40
50
id
The electronic form of this topic is solely for direct use at UCLA and only by faculty, students, and staff of UCLA.


