Graphics Reference
In-Depth Information
8.4
Setting and controlling axis titles
This section provides more details about the use of axis title options for providing titles
for axes. For more information, see [
G
]
axis title options
. For this section, we will use
the
vg past
scheme.
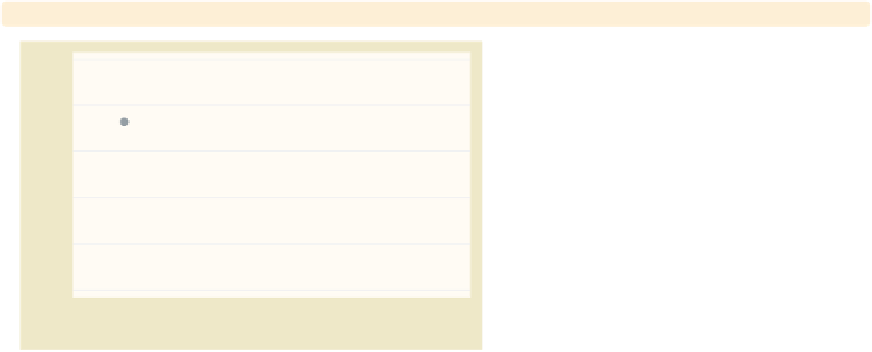
twoway scatter ownhome propval100
Consider this graph of the percentage
of home owners by the percentage of
homes that cost over one hundred
thousand dollars. The titles of the
x
-
and
-axes are the names of the
variables, unless the variables are
labeled, in which case the default title
is the variable label. In this example,
the axes are labeled with the variable
labels.
Uses allstatesdc.dta & scheme vg past
y
0
20
40
60
80
100
% homes cost $100K+
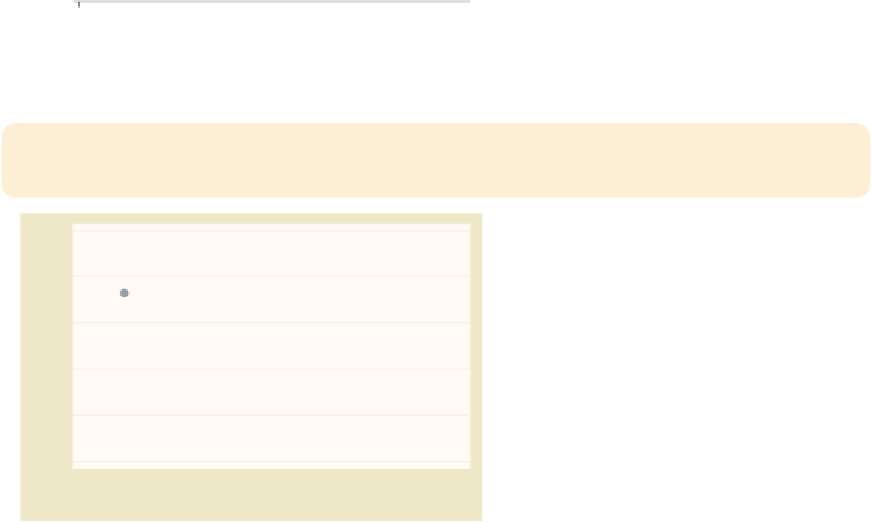
twoway scatter ownhome propval100,
ytitle("Percent of households that own their homes")
xtitle("Percent of homes that cost over $100,000")
We can use the
xtitle()
and
ytitle()
options to supply our own titles.
Uses allstatesdc.dta & scheme vg past
0
20
40
60
80
100
Percent of homes that cost over $100,000
The electronic form of this topic is solely for direct use at UCLA and only by faculty, students, and staff of UCLA.