Graphics Reference
In-Depth Information
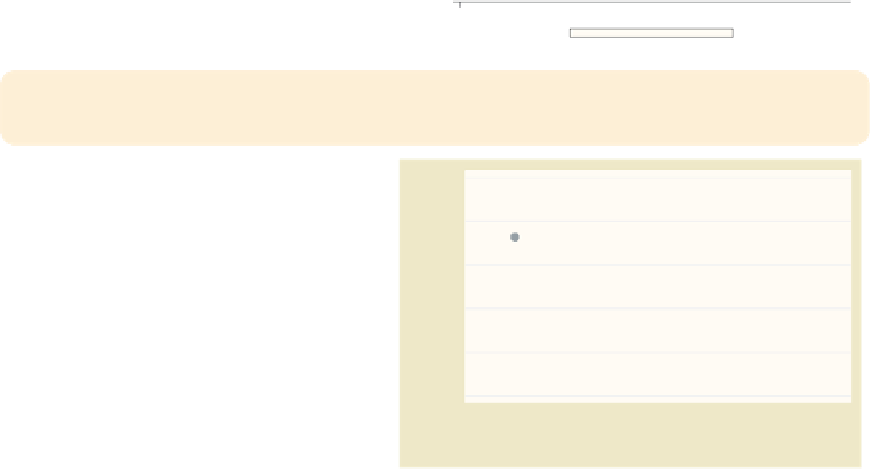
twoway scatter ownhome propval100,
ytitle("Percent of households that own their homes")
xtitle("Percent of homes that cost over $100,000",
size(small) box
)
Because an axis title is considered a
textbox, you can use textbox options,
as illustrated here, to control the look
of the axis title. Here, we add the
size()
and
box
options to
xtitle()
to
make the
-axis title small with a box
around it. See
Options : Textboxes
(303)
for additional examples of how to use
textbox options to control the display
of text.
Uses allstatesdc.dta & scheme vg past
x
0
20
40
60
80
100
Percent of homes that cost over $100,000
twoway scatter ownhome propval100,
ytitle(
"Percent of households" "that own their homes"
)
xtitle(
"Percent of homes" "that cost over $100,000"
)
In this example, we supply the same
titles but divide them into two separate
quoted strings, which then are
displayed on separate lines.
Uses allstatesdc.dta & scheme vg past
0
20
40
60
80
100
Percent of homes
that cost over $100,000
twoway scatter ownhome propval100,
ytitle("1990 Census Data",
suffix
)
xtitle("In 1990 dollars",
prefix
)
We can use the
prefix
and
suffix
options to add information before or
after the existing title, respectively.
Uses allstatesdc.dta & scheme vg past
0
20
40
60
80
100
In 1990 dollars
% homes cost $100K+
The electronic form of this topic is solely for direct use at UCLA and only by faculty, students, and staff of UCLA.