Graphics Reference
In-Depth Information
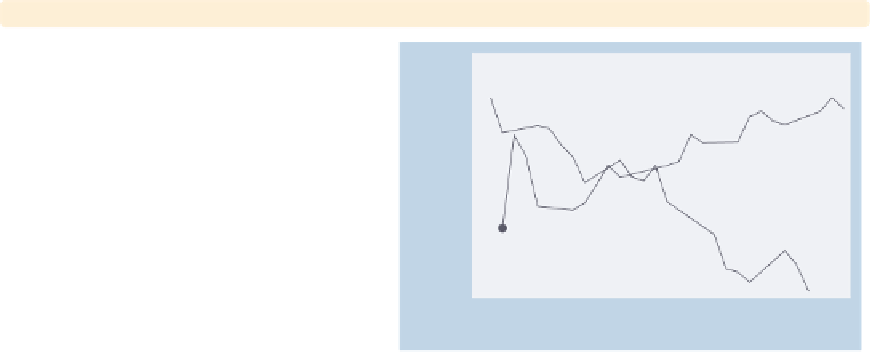
twoway scatter close dom, connect(l)
sort(tradeday)
We need to sort the observations by
tradeday
, using the
sort(tradeday)
option. This graph is almost what we
want, but the observation for January
31 is connected to the observation for
February 1.
Uses spjanfeb2001.dta & scheme
vg blue
1400
1350
1300
1250
0
10
20
30
Day of month
twoway scatter close dom,
connect(L)
sort(tradeday)
This graph is what we wanted to create.
The
connect(L)
option avoids the line
connecting January 31 and February 1
because it connects points only as long
as
dom
is increasing. When
dom
decreases from 31 to 1, the
connect(L)
option does not connect those two
points. See
Styles : Connect
(332) for
more details on
connect()
options.
Uses spjanfeb2001.dta & scheme
vg blue
1400
1350
1300
1250
0
10
20
30
Day of month
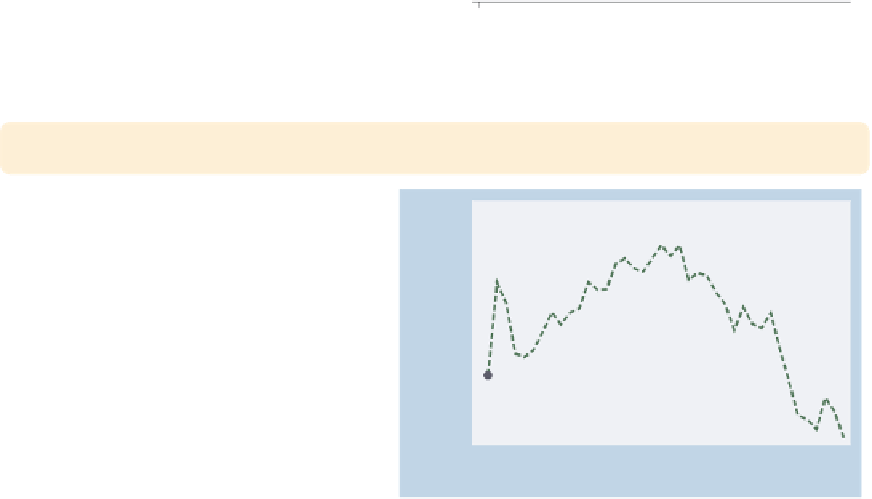
twoway scatter close tradeday, connect(l) sort
clcolor(green) clwidth(thick) clpattern(dash)
The
connect()
option determines how
the markers are connected but not the
color, width, or pattern of the line.
Here, we use the
clcolor()
(connect
line color),
clwidth()
(connect line
width), and
clpattern()
(connect line
pattern) options to make the line green,
thick, and dashed. See
Styles : Colors
(328),
Styles : Linewidth
(337), and
Styles : Linepatterns
(336) for more
information.
Uses spjanfeb2001.dta & scheme
vg blue
1400
1350
1300
1250
0
10
20
30
40
Trading day number
The electronic form of this topic is solely for direct use at UCLA and only by faculty, students, and staff of UCLA.