Graphics Reference
In-Depth Information
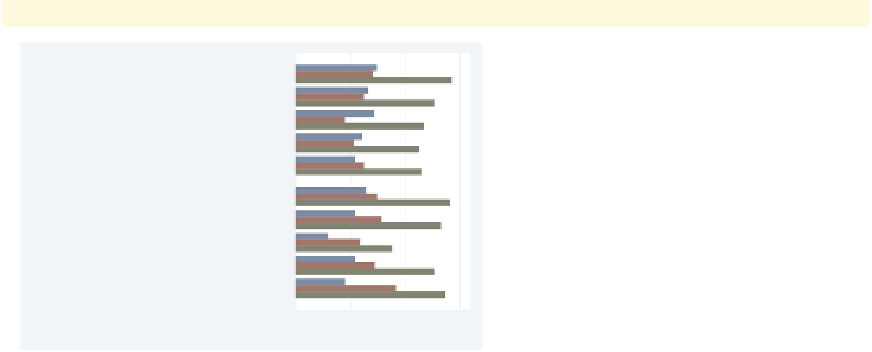
graph hbar prev exp tenure ttl exp, over(occ5)
over(union)
We can take the previous graph and
further break the results down by
whether one belongs to a union. Note,
however, that we cannot add a third
over()
option when we have multiple
y
Prof/Mgmt
Sales
nonunion
Clerical
Labor/Ops
mean of prev_exp
Other
-variables.
Uses nlsw.dta & scheme vg lgndc
mean of tenure
Prof/Mgmt
Sales
mean of ttl_exp
union
Clerical
Labor/Ops
Other
0
5
10
15
Now let's consider options that may be used in combination with the
over()
option to
customize the behavior of the graphs. We show how you can treat the levels of the variable
in the first
over()
option as though they were multiple
-variables and can even graph
those levels as percentages or stacked bar charts. You can also request that missing values
for the levels of the
over()
variables be displayed, and you can suppress empty levels when
multiple
over()
options are used.
y
These examples are shown below using the
vg rose
scheme.
graph bar wage, over(occ5) over(union)
Consider this graph, where we show
wages broken down by occupation and
whether one belongs to a union. The
labels for the levels of
occ5
overlap, but
this is mended in the next example.
Uses nlsw.dta & scheme vg rose
10
8
6
4
2
0
Prof/MgmS
a
les
C
lerical
La
b
or/OpO
th
er
Prof/MgmS
a
les
C
lerical
La
b
or/OpO
t
her
nonunion
union
The electronic form of this topic is solely for direct use at UCLA and only by faculty, students, and staff of UCLA.