Graphics Reference
In-Depth Information
Now, let's look at examples of using multiple
y
-variables with the
over()
option. We
-variables. These examples will use the
vg lgndc
scheme, which places the legend to the left of the graph and displays it in a sin-
gle, stacked column.
first consider a simple bar graph with multiple
y
graph hbar prev exp tenure ttl exp
This graph shows the overall mean of
previous, current, and total work
experience.
Uses nlsw.dta & scheme vg lgndc
mean of prev_exp
mean of tenure
mean of ttl_exp
0
5
10
15
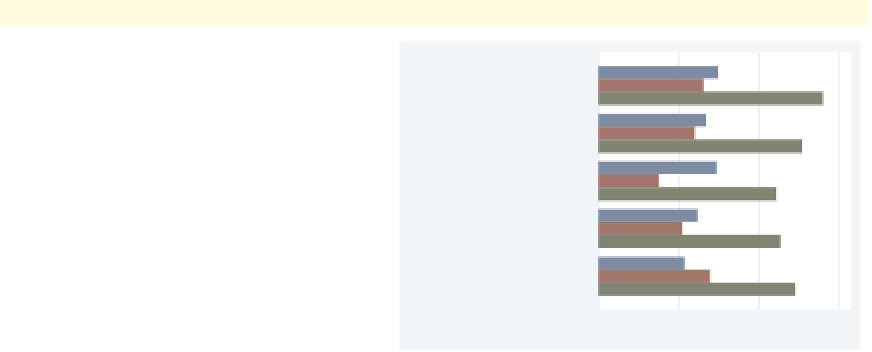
graph hbar prev exp tenure ttl exp,
over(occ5)
We can take the graph from above and
break the means down by whether one
graduated from college by adding the
over(occ5)
option.
Uses nlsw.dta & scheme vg lgndc
Prof/Mgmt
Sales
mean of prev_exp
Clerical
mean of tenure
mean of ttl_exp
Labor/Ops
Other
0
5
10
15
The electronic form of this topic is solely for direct use at UCLA and only by faculty, students, and staff of UCLA.