Graphics Reference
In-Depth Information
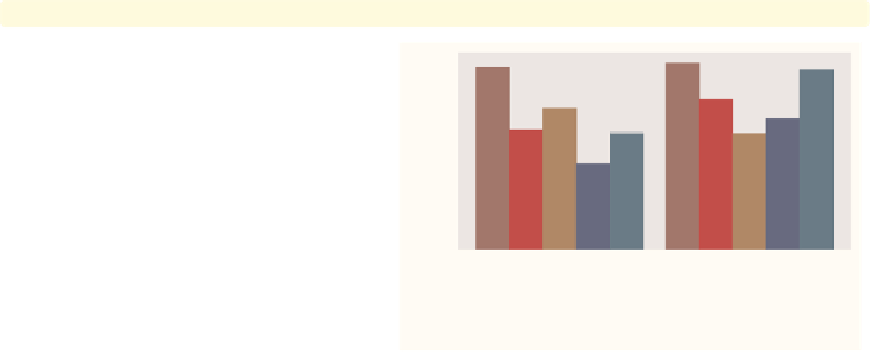
graph bar wage, over(occ5) over(union)
asyvars
If we add the
asyvars
option, then the
first
over()
variable (
occ5
) is graphed
as if there were five
10
-variables
corresponding to the five levels of
occ5
.
The levels of
occ5
are shown as
differently colored bars pushed next to
each other and labeled using the
legend.
Uses nlsw.dta & scheme vg rose
y
8
6
4
2
0
nonunion
union
Prof/Mgmt
Sales
Clerical
Labor/Ops
Other
graph bar wage, over(occ5) over(union) asyvars
percentages
With the levels of
occ5
considered as
y
30
-variables, we can use some of the
options that apply when we have
multiple
-variables. Here, we request
that the values be plotted as
percentages
.
Uses nlsw.dta & scheme vg rose
y
20
10
0
nonunion
union
Prof/Mgmt
Sales
Clerical
Labor/Ops
Other
graph bar wage, over(occ5) over(union) asyvars percentages
stack
Again, because we are treating the
levels of
occ5
as though they were
multiple
100
-variables, we can add the
stack
option to view the graph as a
stacked bar chart.
Uses nlsw.dta & scheme vg rose
y
80
60
40
20
0
nonunion
union
Prof/Mgmt
Sales
Clerical
Labor/Ops
Other
The electronic form of this topic is solely for direct use at UCLA and only by faculty, students, and staff of UCLA.