Biomedical Engineering Reference
In-Depth Information
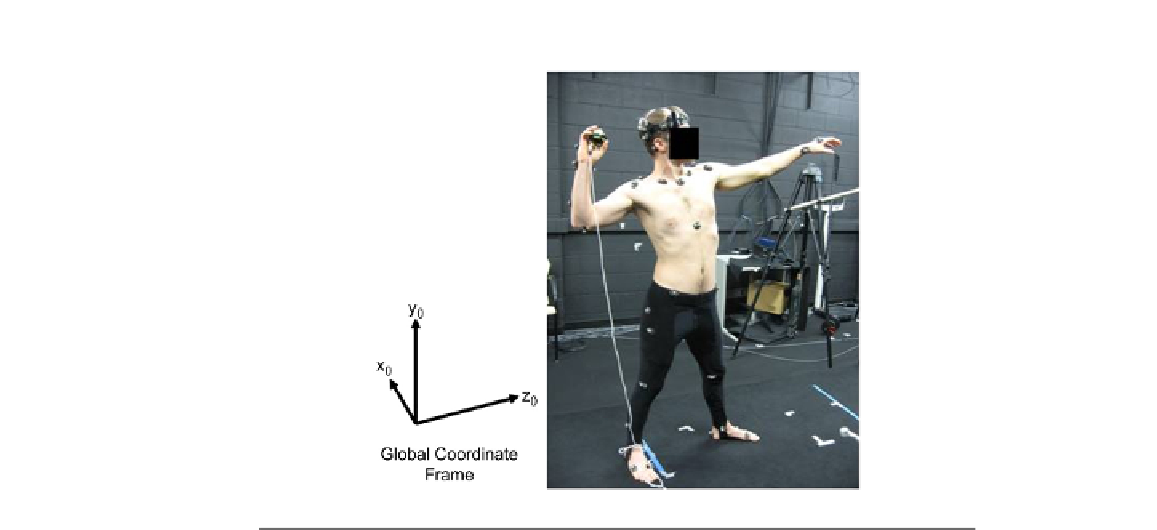
FIGURE 9.4
Subject in the initial posture of the throwing task.
used directly to compare the joint angles based on their position in the cycle. The
time normalization algorithm can be seen in other studies, such as those by
Matsunanga et al. (2004)
and Nadzadi et al. (2003). In this work, the starting
cycle time is defined as
t
5
0, and the ending (release point) time as
t
5
1.
In other words,
Proportion of time
5
ð
t
2
t
0
Þ
ð
t
n
2
t
0
Þ
(9.1)
where
t
0
represents the time point at which the subject is ready to throw the
object and
t
n
represents the time point at which the subject releases the object
from their hand. This approach will be used throughout the chapter.
9.4.2
Validation methodology
The validation methodology involves testing the validity of the PD task to pass
effectively and consecutively through four benchmark tests comprising two quali-
tative and two quantitative comparisons. In general, the benchmark tests depicted
in
Figure 9.5
are ordered by increasing levels of strictness of conformity and vali-
dation effort.
In the qualitative comparison stage, the first benchmark test asks observers to
compare movies or pictures simultaneously played back by two avatars. One ava-
tar uses experimental data, and the other uses predictive data. The first benchmark
test is a very helpful tool that plays a significant role in capturing the differences
Search WWH ::

Custom Search