Environmental Engineering Reference
In-Depth Information
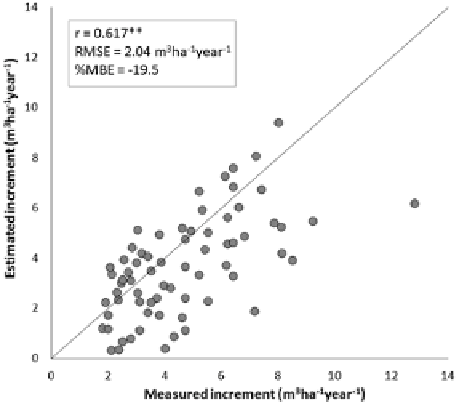
Fig. 5.2
Measured versus
estimated forest
CAI
for
all forest types and regions
considered (n
=
69;
**
=
highly significant
correlation,
P
< 0.01)
comparison was carried out considering all six forest types and summarizing the
results by the correlation coefficient (r), the root mean square error (RMSE) and
the percentage mean bias error (%MBE, i.e. MBE/measured average*100).
The NPP map of Italian forests simulated by the described modeling approach
is shown in Fig.
5.1
. The maximum NPP is around 900 g C m
−
2
year
−
1
, and is
prevalently found on the lowest Alpine and intermediate Apennines zones. As
regards the forest types, the highest productions are obtained for species distrib-
uted over hilly-low mountain areas (i.e. deciduous oaks and chestnut), which are
less affected by thermal and water limitations.
Measured (INFC) and estimated forest CAIs are shown in the scatter plot of
Fig.
5.2
. A moderate accordance is observable (r
=
0.617; RMSE
=
2.04 m
3
ha
−
1
)
and there is a tendency to underestimation (%MBE
=
−
19.5). Most of this under-
estimation derives from Eq.
5.2
, where
FC
A
and
NV
A
are computed using standing
volumes which are significantly lower than those of INFC (%MBE
=
−
23.6). It
can therefore be concluded that the applied modeling strategy is capable of provid-
ing realistic regional CAI estimates using information completely independent of
INFC measurements.
5.2.2 Estimation of Italian Forest NPP. the 3-PG Model
Within the CarboItaly project, the NPP of the Italian forests has also been esti-
mated through the application of a modified version of the widely used 3-PG
model by Landsberg and Waring (
1997
). The 3-PG model as proposed by Nol│
et al. (
2013
) is based on the 3-PGS (Spatial) model (Coops et al.
1998
,
2005
,
2007
; Coops and Waring
2001
; Nol│ et al.
2009
; Tickle et al.
2001
) modified to
run on a daily time step and produce estimates of GPP and NPP improving model