Chemistry Reference
In-Depth Information
Because all of the points are within three standard deviations, we expect
that we are just seeing normal process deviations. If we plot historical values
for the process, we should see that they typically fall within upper and lower
limits similar to the upper and lower limits calculated by taking the mean
±
3 standard deviations. We can use this charting method to use statistical
process control. We do this by setting guidelines for control of the process.
One guideline might be that no adjustments should be made if the process is
“in control”. We can define “in control” as no sample points outside of the
limits (can use either the process limits from historical data or the calculated
limits); most points near average; similar number of points above andbelow
average; and a random distribution of points.
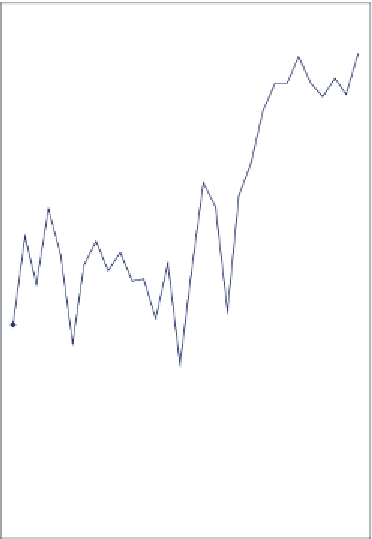
If we accept these control limits and continue to run the process without
adjustment, checking again after 10 more shifts, we see the control chart
(Figure 13.11). The process is out of control. Beginning with sample 22,
60
58
Upper control limit
56
54
52
50
48
46
Lower control limit
44
42
40
024681012141618202224262830
Sample #
Figure 13.11
Process with Samples above Upper Control Limit


Search WWH ::

Custom Search