Chemistry Reference
In-Depth Information
60
58
56
54
52
50
48
46
44
42
40
0
2
4
6
8
10
12
14
16
18
20
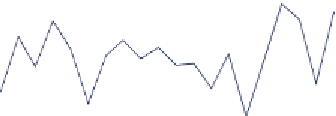
Sample #
Figure 13.9
Graph of Process Results
60
58
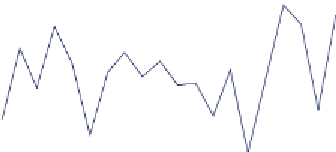
Mean + 3SD
56
54
52
50
48
46
Mean
−
3SD
44
42
40
02468 0 2 4 6 8 0
Sample #
Figure 13.10
Process Results Showing Three Standard Deviations


Search WWH ::

Custom Search