Chemistry Reference
In-Depth Information
60
58
UCL
56
54
52
Mean
50
48
46
LCL
44
42
40
024681012141618202224262830
Sample #
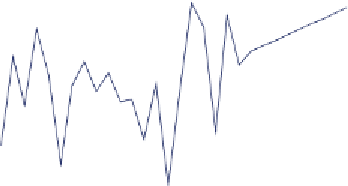
Figure 13.12
Process with Samples not Randomly Distributed
we are above the upper control limit. That shift should have taken corrective
action and made adjustments.
What if the next ten samples had looked like the next chart (Figure 13.12)?
All the data points are within the control limits, but the process is not in
control. The points are not randomly distributed, and there are not a simi-
lar number of points above and below the mean. Corrective action should be
taken. This also began around shift 22 but the trend would probably not be
recognized until several more samples had been tested.
One of the advantages of control charting and statistical process control
is that everyone seems to understand the use and it can be a tool to improve
process consistency. With a set of rules, it can be used to prevent excessive
“tweaking” of a process which can cause increased variability and therefore
decreased quality. It can also give increased process understanding. In the
previous two examples, something changed around shift 22. By going back
through the data logs, the process engineer can often gain an understanding


Search WWH ::

Custom Search