Information Technology Reference
In-Depth Information
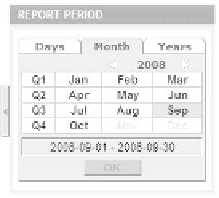
Figure 6.4
Report time period
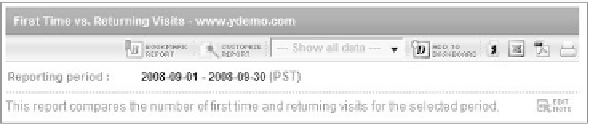
Moving on to the actual report header, we find the name of the report in ques-
tion as well as shortcuts to the most powerful features of Yahoo! Web Analytics. these
features include:
B
•
ookmark report
c
•
ustomize report
•
s
egment report
A
139
•
dd report to Dashboard
•
e
xport report Data
•
p
rint report
All of these features are discussed separately throughout this section, but i will
note that customize report is the nirvana of Web Analytics play!
Finally—and this should not be neglected just because it is a simple implementa-
tion task—there is an opportunity to add notes directly to the report (see Figure 6.5).
You would typically add notes when you change a report; for example, by adding a
filter or a specific set of metrics or dimensions. notes can explain why the report was
changed and how other users are expected to interpret the data.
Figure 6.5
Report header
Most reports are accompanied by a chart that visualizes the quantitative infor-
mation that was requested through the report choice, filter choice, sorting choice, and
so on.
it is with great regret that i have to say that the visualizations are essentially
fixed and decided upon beforehand. the freedom that you have in data selection and
data setup is not replicated in data visualization. the chart allows you to quickly spot
trends and abnormalities, but not at a level you deserve!