Information Technology Reference
In-Depth Information
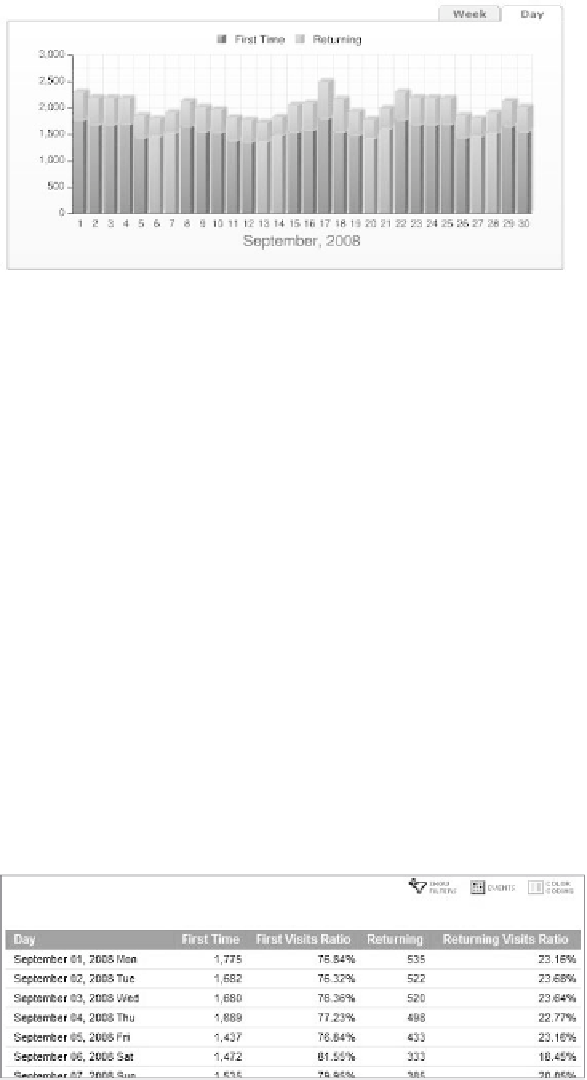
You can choose data grouping, such as whether you want to see the chart on a
daily, weekly, or monthly basis. As you can see in Figure 6.6, this provides some power
to visualize a trend more accurately.
Figure 6.6
Report chart
Depending on the type of report, the report data contains the reporting entries
and the metrics pertaining to them in a tabular form. this is true for most reports;
even when you don't have the table, as in a path analysis report, you are still looking at
the report data modifiers. the report data modifiers, as shown in Figure 6.7, include:
F
140
•
ilters
•
s
orting
e
•
vents
A
•
lerts
•
c
olor-coding
•
D
rill-Downs
•
A
sk it tutor
these modifiers are accessible by clicking the three icons you see at the top
right; by clicking the sorting arrow on top of the metric columns; by clicking the mag-
nifying glass on the left column; or by right-clicking any of the metrics or dimensions.
the report data modifiers are tremendously valuable, and this is where you can drill
into and work with your data.
Figure 6.7
Report data and report data modifiers