Graphics Programs Reference
In-Depth Information
Histograms and Images
Now that all those technical descriptions make perfect sense, let us look at
some images to associate with the histograms and hopefully make better
sense of it all. As the histogram maps the tonal values within an image, the
instant the shutter is snapped you can immediately evaluate where shadow
and highlight information begin, what sort of tonal range exists, and make
important decisions in the i eld accordingly. Remember, there are no right
or wrong histograms; as where data should fall will vary depending on the
tones, content and the mood of an image. Here is how:
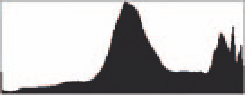
Example 1. Overexposed
One can determine and evaluate many things about an image capture in
the i eld from the histogram data. If the image as seen on the next page
is the scene you desire, but you see a histogram such as the one on the
left (Fig. 1), you would know right away there was a problem. Notice the
data slam into the right side of the chart. This histogram would indicate
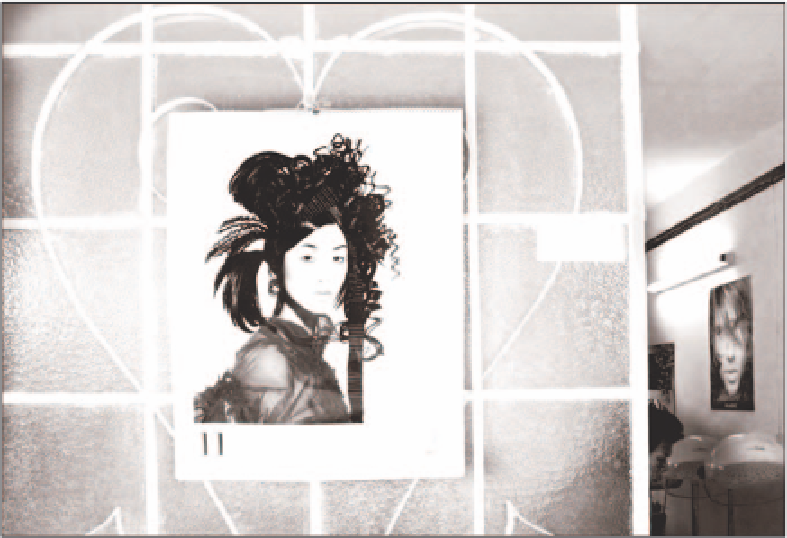
that the shot has been overexposed as shown below, with highlights and
white values blown out. The scene of the doorway and heart shape need
the highlights well exposed for detail in the those areas. Therefore, this
histogram would indicate that exposure should be decreased via a faster
shutter speed, narrower aperture, or lower ISO setting and re-exposed,
FIG 1: Overexposed image data for
corresponding image pictured below

Search WWH ::

Custom Search