Graphics Programs Reference
In-Depth Information
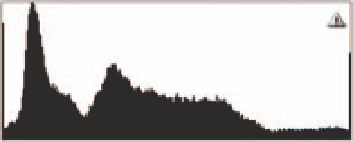
gain full tonal range in a print. In viewing a histogram such as this, evaluate
whether highlight or shadow information should take precedence and
re-expose for that information.
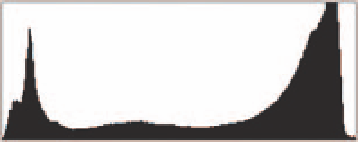
Preserved Shadow and Highlight Information
The histogram below would indicate an image exposed with full tonal range.
Highlight and shadow information are preserved without clipping, as the data
clearly ends before the walls of the histogram on either side.
Contrast
The width of the data spread within a histogram rel ects how much contrast
the image contains. Narrow histograms indicate less contrast with a limited
range of tones while wider histograms indicate greater contrast or a wider
range of tones from light to dark.
High Contrast
The histogram below indicates high contrast within the corresponding image.
Full tonal range is being utilized, without loss of detail in either shadow nor
highlight information.
Note:
It is really important,
however, not to get
too overly obsessive
about the histogram
in a technical sense.
The truth is a perfect
histogram does not
always equate to a
good image and a bad
histogram does not
always dictate failure.
Use the information
to make creative
decisions in the i eld and
experiment with how
far you can push the
extremes and still create
successful images.
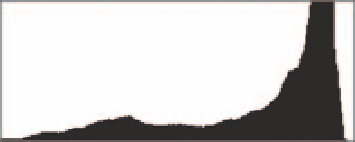
Low Contrast
The following histogram indicates a low contrast image. The full tonal range
is not being utilized. The corresponding image will therefore appear l at with
little contrast, as the information is weighted heavily by midtone values.
Good or bad? Answer: depends on the image.


Search WWH ::

Custom Search