Biomedical Engineering Reference
In-Depth Information
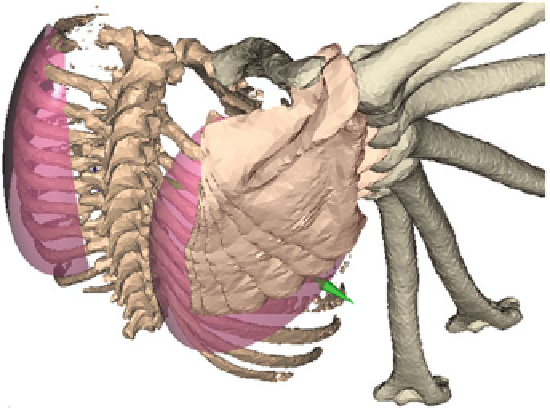
Fig. 9.12
ShRm visualization (right shoulder, posterosuperior view). These results were obtained
after optimization from humeral poses (6 key snapshots are displayed here) to predict the position
and orientation of the scapula and clavicle using the presented method
9.4.1 Final Results: Motion Representation and Visualization After
ShRm Estimation
The following section shows results obtained from the above regression equations
to estimate the instantaneous poses of the ShRm Scap and Clav components during
Hum displacements in the thoracohumeral joint. Hum and Thor motion data were
collected using the same stereophotogrammetry system as described in section “Data
collection for scaling method”. A supplementary correction (see previous section)
was applied to avoid scapula gliding artefacts along the thorax surface.
Figures
9.10
and
9.11
show the estimation results for Scap and Clav during Hum
extension/flexion and adduction/abduction.
Graphical visualization of the 3D segments and estimated Scap and Clav displace-
mentsareshowninFig.
9.12
(see also [
82
] supplementary material movies). Results
are similar to qualitative and quantitative description found in the literature [
3
,
9
,
13
-
15
,
20
].
9.5 Conclusion
The presented approach for ShRm estimation was entirely obtained from data col-
lected from validated experiments to gather as much physiological information as
possible. Anatomical realism of the results allows applying the developed method