Digital Signal Processing Reference
In-Depth Information
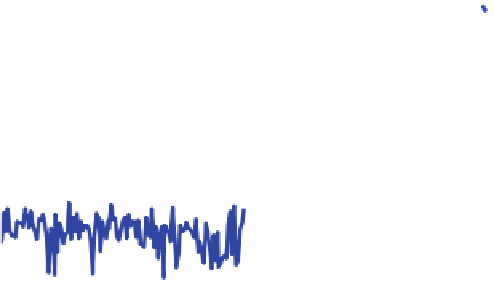
NORMAL SIGNAL X1
15
10
5
0
0
0.1
0.2
0.3
0.4
0.5
ω
UNIFORM SIGNAL X2
15
10
5
0
0
0.1
0.2
0.3
0.4
0.5
ω
Fig. 7.30
PSDs in Exercise M.7.1
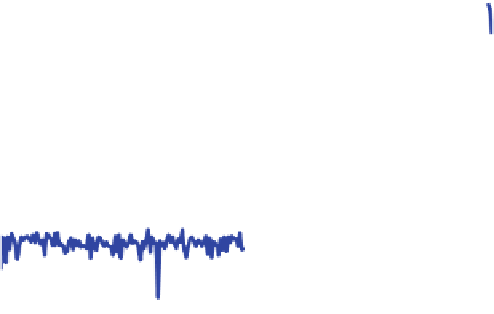
NORMAL SIGNAL X1
10
2
10
0
10
-2
0
0.1
0.2
0.3
0.4
0.5
w
UNIFORM SIGNAL X2
10
5
10
0
10
-5
0
0.1
0.2
0.3
0.4
0.5
w
Fig. 7.31
PSDs (logarithmic scale) in Exercise M.7.1
Figure
7.32
presents the ACFs. For the sake of comparison, both ACFs and PSDs
are shown together in Fig.
7.33
.
Exercise M.7.2
(MATLAB file
exercise_M_7_2.m
) Sinusoidal signals of ampli-
tude
A
and frequencies
f
1
¼
150 Hz and
f
2
¼
250 Hz are added to the random


Search WWH ::

Custom Search